EViews 10 New Features

"…improvements to our powerful graphing and presentation quality output…"
New Graph, Table and Spool Features
Each version of EViews has always introduced improvements to our powerful graphing and presentation quality output engine, and EViews 10 is no different. Here are some of the improvements we've made to graphs in this version.
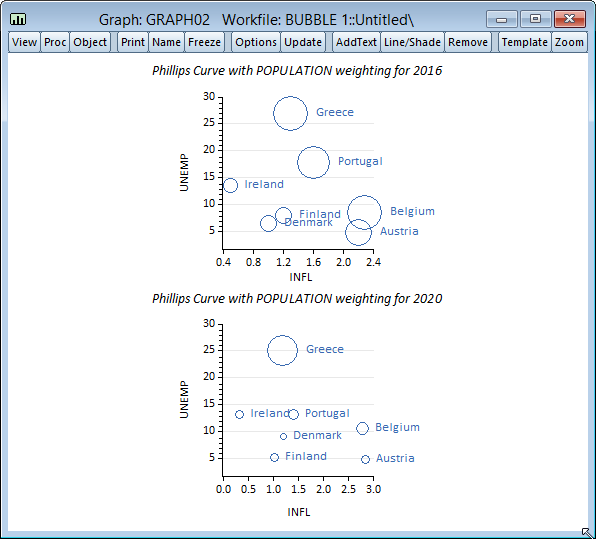
Bubble Plots
EViews 10 introduces bubble plots as a new graph type. Bubble plots are extensions of scatter plots, where a third dimension may be used to specify the size of the data points. Unlike traditional scatter plots, where bubble sizes are fixed, bubble plots allow for variable size bubbles
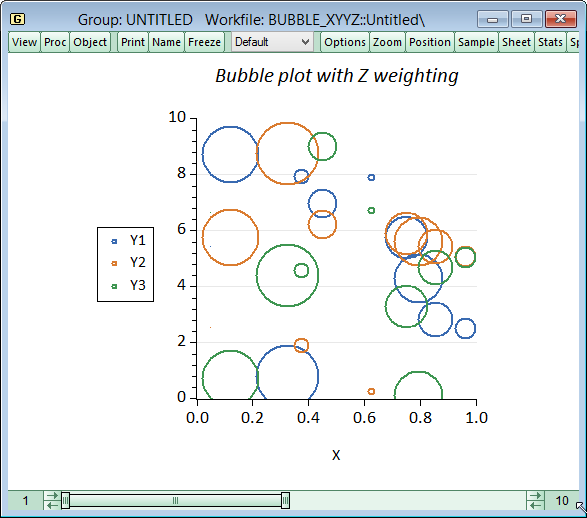
Observation labels can be added to annotate each bubble.
Graph Series Updating
EViews 10 makes working with graphs easier. You can now add and remove series via the mouse and keyboard, allowing you to quickly manipulate your visualisations.
You can drag a series from your workfile directly onto your graph object, and then delete one simply by clicking on the series to be removed and pressing the delete key.
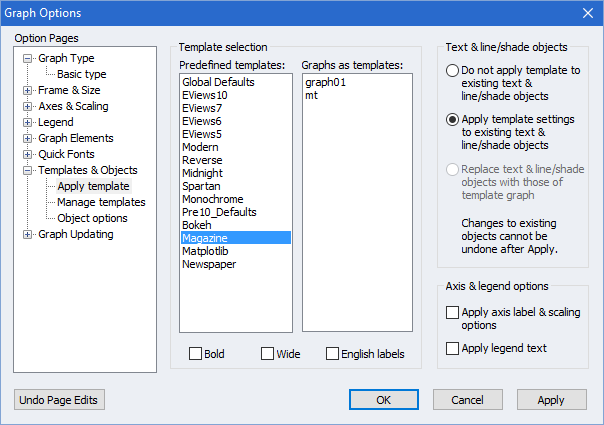
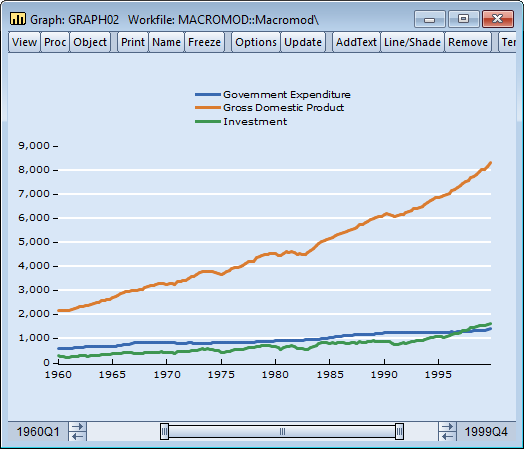
New Default Graph Styles
EViews 10 introduces a new default graph template. Some of the new design elements of this template include a different aspect ratio, white background, grid lines, and thicker lines in line graphs.
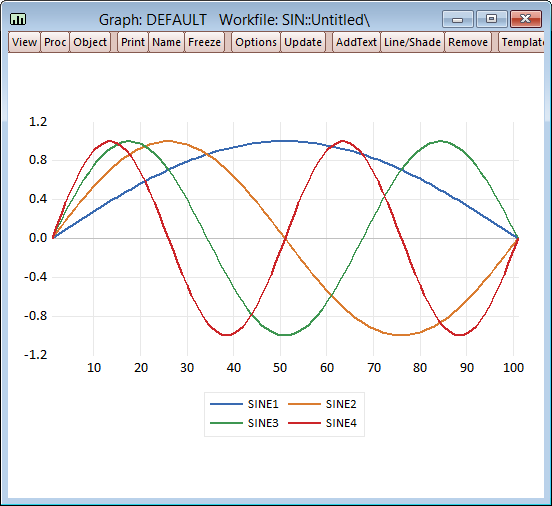
Along with the new default template, a number of other new templates are included for you to choose from.
Miscellaneous Improvements
EViews 10 includes new graph options in our graphs. These are:
- The ability to add text to graph views.
- New line and bar colors.
- The ability to add minor ticks to the data axis.
- Manually set the number of grid lines.
- Pin graph flyovers as permanent text.
- Increased options for text positioning.
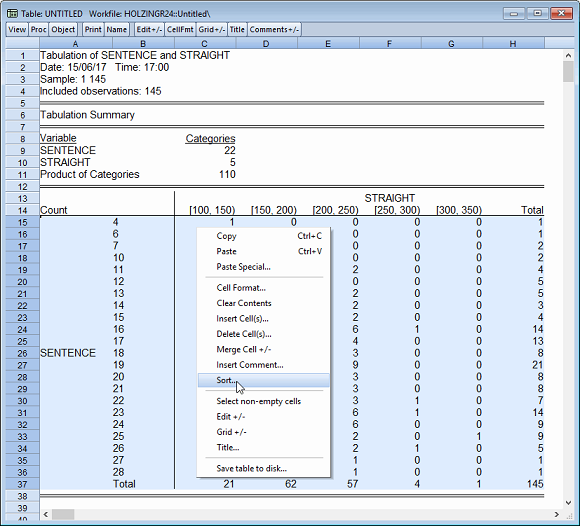
Table Sorting
In EViews 10 you may easily sort the rows of a table using values in one or more columns. To sort, you must be in table edit mode.