Specifying an Equation in EViews
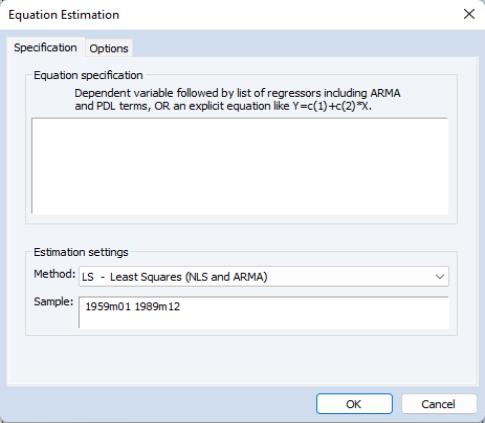
When you create an equation object, a specification dialog box is displayed.
You need to specify three things in this dialog: the equation specification, the estimation method, and the sample to be used in estimation.
In the upper edit box, you can specify the equation: the dependent (left-hand side) and independent (right-hand side) variables and the functional form. There are two basic ways of specifying an equation: “by list” and “by formula” or “by expression”. The list method is easier but may only be used with unrestricted linear specifications; the formula method is more general and must be used to specify nonlinear models or models with parametric restrictions.
Specifying an Equation by List
The simplest way to specify a linear equation is to provide a list of variables that you wish to use in the equation. First, include the name of the dependent variable or expression, followed by a list of explanatory variables. For example, to specify a linear consumption function, CS regressed on a constant and INC, type the following in the upper field of the dialog:
cs c inc
Note the presence of the series name C in the list of regressors. This is a built-in EViews series that is used to specify a constant in a regression. EViews does not automatically include a constant in a regression so you must explicitly list the constant (or its equivalent) as a regressor. The internal series C does not appear in your workfile, and you may not use it outside of specifying an equation. If you need a series of ones, you can generate a new series, or use the number 1 as an auto-series.
You may have noticed that there is a pre-defined object C in your workfile. This is the default coefficient vector—when you specify an equation by listing variable names, EViews stores the estimated coefficients in this vector, in the order of appearance in the list. In the example above, the constant will be stored in C(1) and the coefficient on INC will be held in C(2).
Lagged series may be included in statistical operations using the same notation as in generating a new series with a formula—put the lag in parentheses after the name of the series. For example, the specification:
cs cs(-1) c inc
tells EViews to regress CS on its own lagged value, a constant, and INC. The coefficient for lagged CS will be placed in C(1), the coefficient for the constant is C(2), and the coefficient of INC is C(3).
You can include a consecutive range of lagged series by using the word “to” between the lags. For example:
cs c cs(-1 to -4) inc
regresses CS on a constant, CS(-1), CS(-2), CS(-3), CS(-4), and INC. If you don't include the first lag, it is taken to be zero. For example:
cs c inc(to -2) inc(-4)
regresses CS on a constant, INC, INC(-1), INC(-2), and INC(-4).
You may include auto-series in the list of variables. If the auto-series expressions contain spaces, they should be enclosed in parentheses. For example:
log(cs) c log(cs(-1)) ((inc+inc(-1)) / 2)
specifies a regression of the natural logarithm of CS on a constant, its own lagged value, and a two period moving average of INC.
Typing the list of series may be cumbersome, especially if you are working with many regressors. If you wish, EViews can create the specification list for you. First, highlight the dependent variable in the workfile window by single clicking on the entry. Next, CTRL-click on each of the explanatory variables to highlight them as well. When you are done selecting all of your variables, double click on any of the highlighted series, and select , or right click and select . The dialog box should appear with the names entered in the specification field. The constant C is automatically included in this list; you must delete the C if you do not wish to include the constant.
Specifying an Equation by Formula
You will need to specify your equation using a formula when the list method is not general enough for your specification. Many, but not all, estimation methods allow you to specify your equation using a formula.
An equation formula in EViews is a mathematical expression involving regressors and coefficients. To specify an equation using a formula, simply enter the expression in the dialog in place of the list of variables. EViews will add an implicit additive disturbance to this equation and will estimate the parameters of the model using least squares.
When you specify an equation by list, EViews converts this into an equivalent equation formula. For example, the list,
log(cs) c log(cs(-1)) log(inc)
is interpreted by EViews as:
log(cs) = c(1) + c(2)*log(cs(-1)) + c(3)*log(inc)
Equations do not have to have a dependent variable followed by an equal sign and then an expression. The “=” sign can be anywhere in the formula, as in:
log(urate) - c(1)*dmr = c(2)
The residuals for this equation are given by:
 | (20.1) |
EViews will minimize the sum-of-squares of these residuals.
If you wish, you can specify an equation as a simple expression, without a dependent variable and an equal sign. If there is no equal sign, EViews assumes that the entire expression is the disturbance term. For example, if you specify an equation as:
c(1)*x + c(2)*y + 4*z
EViews will find the coefficient values that minimize the sum of squares of the given expression, in this case (C(1)*X+C(2)*Y+4*Z). While EViews will estimate an expression of this type, since there is no dependent variable, some regression statistics (e.g. R-squared) are not reported and the equation cannot be used for forecasting. This restriction also holds for any equation that includes coefficients to the left of the equal sign. For example, if you specify:
x + c(1)*y = c(2)*z
EViews finds the values of C(1) and C(2) that minimize the sum of squares of (X+C(1)*Y–C(2)*Z). The estimated coefficients will be identical to those from an equation specified using:
x = -c(1)*y + c(2)*z
but some regression statistics are not reported.
The two most common motivations for specifying your equation by formula are to estimate restricted and nonlinear models. For example, suppose that you wish to constrain the coefficients on the lags on the variable X to sum to one. Solving out for the coefficient restriction leads to the following linear model with parameter restrictions:
y = c(1) + c(2)*x + c(3)*x(-1) + c(4)*x(-2) + (1-c(2)-c(3)-c(4)) *x(-3)
To estimate a nonlinear model, simply enter the nonlinear formula. EViews will automatically detect the nonlinearity and estimate the model using nonlinear least squares. For details, see
“Nonlinear Least Squares”.
One benefit to specifying an equation by formula is that you can elect to use a different coefficient vector. To create a new coefficient vector, choose and select from the main menu, type in a name for the coefficient vector, and click
OK. In the dialog box that appears, select
Coefficient Vector and specify how many rows there should be in the vector. The object will be listed in the workfile directory with the coefficient vector icon (the little

).
You may then use this coefficient vector in your specification. For example, suppose you created coefficient vectors A and BETA, each with a single row. Then you can specify your equation using the new coefficients in place of C:
log(cs) = a(1) + beta(1)*log(cs(-1))