Graph
Graph object. Specialized object used to hold graphical output.
Graph Declaration
freeze freeze graphical view of object.
graph create graph object using graph command or by merging existing graphs.
Graphs may be created by declaring a graph using one of the graph commands described below, or by freezing the graphical view of an object. For example:
graph myline.line ser1
graph myscat.scat ser1 ser2
graph myxy.xyline grp1
declare and create the graph objects MYLINE, MYSCAT and MYXY. Alternatively, you can use the freeze command to create graph objects:
freeze(myline) ser1.line
group grp2 ser1 ser2
freeze(myscat) grp2.scat
freeze(myxy) grp1.xyline
which are equivalent to the declarations above.
Graph Type Commands
Graph creation types are discussed in detail in
“Graph Creation Command Summary”.
bubbletrip bubble plot graph specified as triplets.
hilo high-low(-open-close) graph.
qqplot quantile-quantile graph.
Graph View
display display table, graph, or spool in object window.
label label information for the graph.
Graph Procs
addarrow draw a line or arrow on a graph.
addrect draw a rectangle on a graph.
addtext place arbitrary text on the graph.
align align the placement of multiple graphs.
axis set the axis scaling and display characteristics for the graph.
clearhist clear the contents of the history attribute.
copy creates a copy of the graph.
datalabel controls labeling of the observations/data in time plots. (
new)
datelabel controls labeling of the bottom date/time axis in time plots.
delete removes all objects of specified type from a graph object.
draw draw lines and shaded areas on the graph.
drawdefault set default settings for lines and shaded areas on the graph.
legend control the appearance and placement of legends.
makegroup creates a group object containing all the series in the graph.
merge merge graph objects.
name change the series name for legends or axis labels.
olepush push updates to OLE linked objects in open applications.
options change the option settings of the graph.
save save graph to a graphics file.
setattr set the value of an object attribute.
setbpelem set options for element of a boxplot graph.
setelem set individual line, symbol, bar and legend options for each series in the graph.
setfont set the font for the text in a graph.
setobslabel set custom axis labels for observation scale of a graph.
sort sort the series in a graph.
textdefault set default settings for text objects in the graph.
update update graph with data changes.
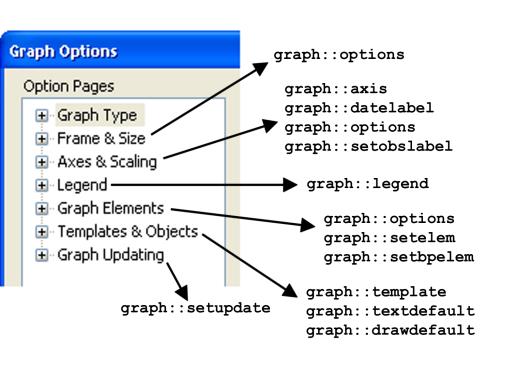
The relationship between the elements of the graph dialog and the associated graph procs is illustrated below:
Graph Data Members
Scalar Values
@axismin(axis) returns the minimum value for the specified axis. Acceptable values for axis are “t”, “l”, “b”, “r”, for top, left, bottom, right.
@axismax(axis) returns the maximum value for the specified axis. Acceptable values for axis are “t”, “l”, “b”, “r”, for top, left, bottom, right.
@axispos(value, axis) returns the location in virtual inches of the specified data value on the graph. value is in the same units as the specified axis. When specifying a date for value, the string must be quoted. Acceptable values for axis are “t”, “l”, “b”, “r” for top, left, bottom, right.
String Values
@attr("arg") string containing the value of the arg attribute, where the argument is specified as a quoted string.
@description returns a string containing the object description (if available).
@detailedtype returns a string with the object type: “GRAPH”.
@displayname returns a string containing the Graph’s displayname. If the Graph has no display name set, the name is returned.
@members string containing a space delimited list of the names of the series contained in the Graph.
@name returns a string containing the Graph’s name.
@remarks returns a string containing the Graph’s remarks (if available).
@type returns a string with the object type: “GRAPH”.
@updatetime returns a string representation of the time and date at which the Graph was last updated.
Graph Examples
You can declare your graph:
graph abc.xyline(m) unemp gnp inf
graph bargraph.bar(d,l) unemp gnp
Alternately, you may freeze any graphical view:
freeze(mykernel) ser1.distplot kernel
You can change the graph type,
graph mygraph.line ser1
mygraph.hist
or combine multiple graphs:
graph xyz.merge graph1 graph2