The Granger (1969) approach to the question of whether  causes
  is to see how much of the current
  can be explained by past values of
  and then to see whether adding lagged values of
  can improve the explanation.
  is said to be Granger-caused by
  if
if  helps in the prediction of
  , or equivalently if the coefficients on the lagged
  ’s are statistically significant. Note that two-way causation is frequently the case;
  Granger causes
  and
and  Granger causes
  .
.
causes is to see how much of the current can be explained by past values of and then to see whether adding lagged values of can improve the explanation. is said to be Granger-caused by if helps in the prediction of , or equivalently if the coefficients on the lagged ’s are statistically significant. Note that two-way causation is frequently the case; Granger causes and Granger causes .  Granger causes
  ” does not imply that
  is the effect or the result of
  . Granger causality measures precedence and information content but does not by itself indicate causality in the more common use of the term.
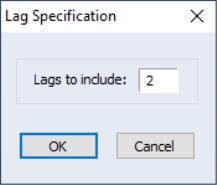
 , that corresponds to reasonable beliefs about the longest time over which one of the variables could help predict the other.
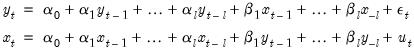
 series in the group. The reported
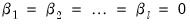
 does
does  in the first regression and that
  does
does  in the second regression.