Panel Stacked Analysis
A wide range of analyses are available in panel structured workfiles that have not been specifically redesigned to use the panel structure of your data. These tools allow you to work with and analyze the stacked data, while taking advantage of the support for handling lags and leads in the panel structured workfile.
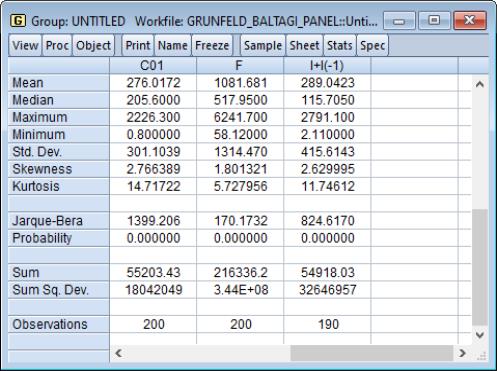
We may, for example, take our example panel workfile, create a group containing the series C01, F, and the expression I+I(-1), and then select from the group menu. EViews displays the descriptive statistics for the stacked data.
Note that the calculations are performed over the entire 200 observation stacked data, and that the statistics for I+I(-1) use only 190 observations (200 minus 10 observations corresponding to the lag of the first observation for each firm).
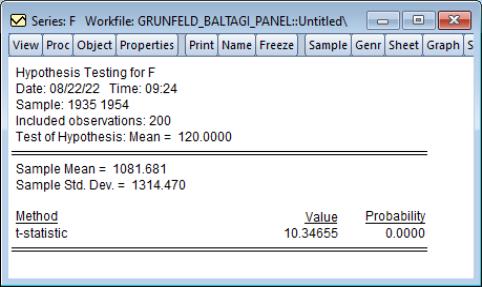
Similarly, suppose you wish to perform a hypothesis testing on a single series. Open the window for the series F, and select . Enter “120” in the edit box for testing the mean value of the stacked series against a null of 120. EViews displays the results of a simple hypothesis test for the mean of the 200 observation stacked data.
While a wide variety of stacked analyses are supported, various views and procedures are not available in panel structured workfiles. You may not, for example, perform seasonal adjustment or estimate ARCH or state space models with the stacked panel.