Multi-graph Slideshow
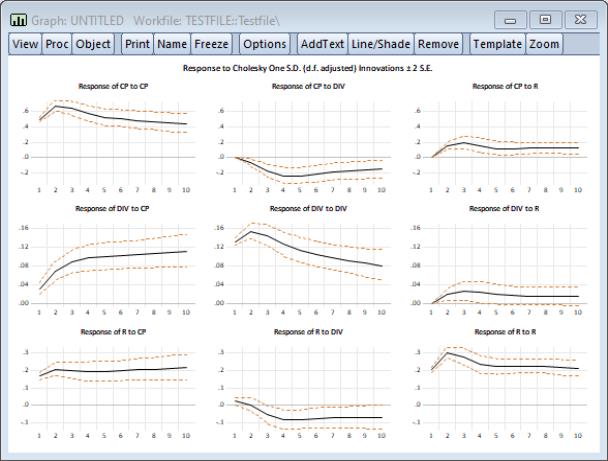
The graph slideshow makes it easier to examine multiple graphs in the number of graphs in the frame results in individual graphs where it is too small to see any detail. Consider, for example, the frozen graph of impulse responses for a three variable VAR:
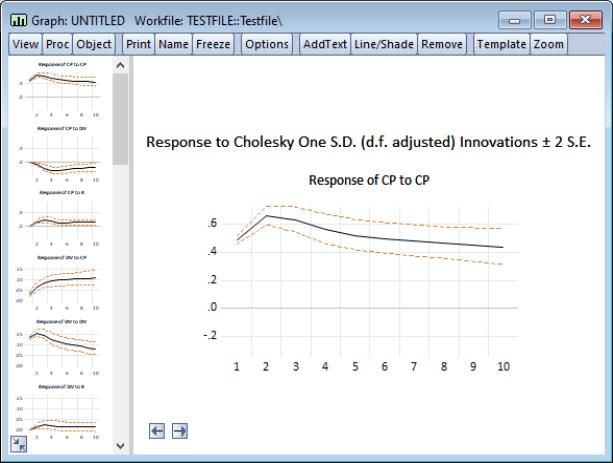
EViews allows you to zoom in on the individual graphs and to display the contents of the graph in a slideshow format. Click on the button on the toolbar to enable the slideshow:
Here we see the zoom view. On the left is a gallery of the individual graphs; on the right is a larger display of the selected graph. You can page through the individual graphs using the arrow keys or to select the next graph, or the and keys to move to the first or last graph. Alternately, you can click on a gallery item to jump to that graph.
Click on ESC to exit zoom mode.
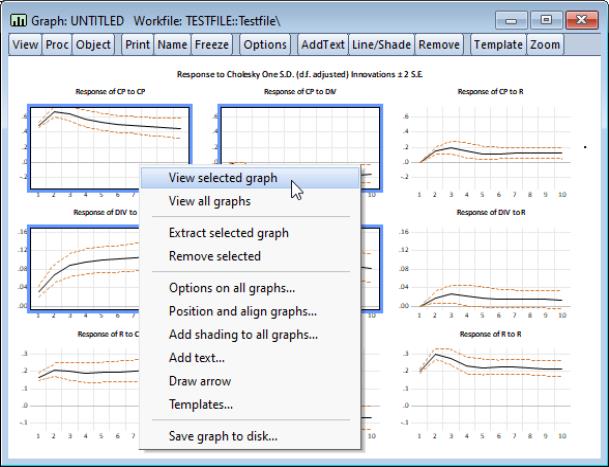
If you wish to enable the slideshow for a subset of the graphs, return to the original graph and select the graphs of interest by shift or control clicking or by drag clicking, then press the button or right-mouse click and select
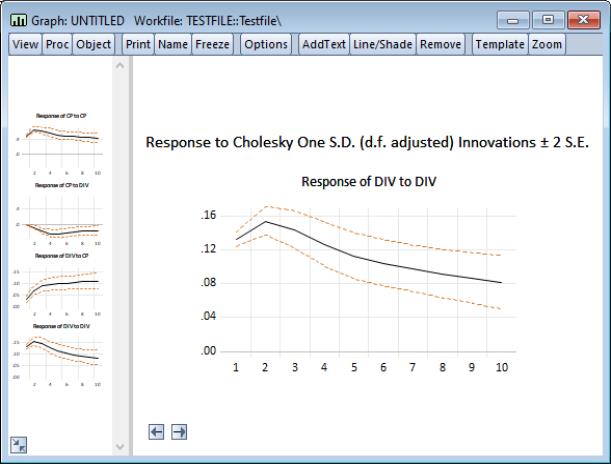
then press the button or right-mouse click and select . EViews will show the gallery for just the selected items: