Comparing Solution Data
The menu item, available from the menu, allows you to quickly view any differences between the solution values for different scenarios.
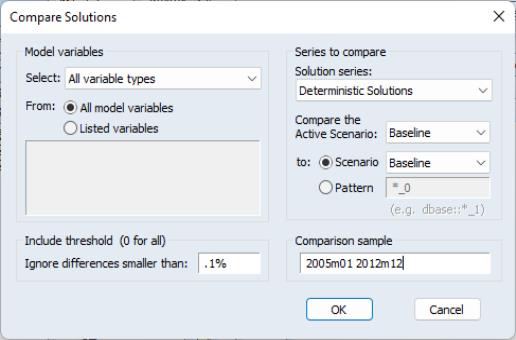
Once you have solved your model for different scenarios, you may wish to quickly compare the results between those scenarios to see which variables differ. Clicking on the menu item ... brings up a dialog that allows you to do this. The first part of the dialog is similar to that of the data display dialog above. Select which variables you would like to compare by using the drop-down box, and the edit field.
Having selected your variable, you may select which scenarios to compare using the area. The first choice, using the drop-down is whether you wish to compare the deterministic solutions, or compare the means from a stochastic solve. Note you must have already performed the type of solve you choose prior to comparing it.
The drop-down lets you choose the set of variables for comparison. By default the drop-down will be set at the model’s current active scenario. Note changing this drop-down to another entry will change the active scenario for the model, as well as for comparison.
There are two choices for specifying the second set of variables. You may either select a comparison scenario (by selecting the radio button, and then selecting the scenario in the drop-down), or you may specify a pattern matching scheme by selecting the radio button. With pattern matching, you should use the “*” wildcard to represent the variable names in the pattern. For example, if you wish to compare I_0 (the current active scenario) with a series called I_OLD, you would enter a pattern of “*_OLD”, having specified I as the variable to compare. Note that you may reference series stored in a database using the standard dbname:: syntax, or series in another page using the standard pagename\ syntax.
The series used for comparison should already exist in the workfile (or storage location if you specified another container with pattern matching). Note this means that you should have already solved the model for the specified scenario if applicable.
The edit box lets you set the tolerance level for detecting differences between the solutions. By default it is set to 0.1% - i.e. any relative difference less than 0.001 will be ignored. You can specify a value of 0 to tell EViews to show all differences, no matter how small.
Finally the edit field lets you set the sample over which you wish to compare the series.
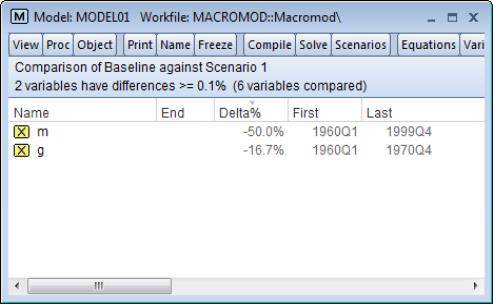
Clicking produces the comparison table:
The table lists any variables for which the percentage difference between the two series for each scenario is greater than the specified tolerance.
In this case we are comparing the solution between the Baseline scenario (_0) and Scenario 1 (_1), and two variables, M and G, have a difference greater than the specified tolerance of 1e-04. The four columns in the table show details about the variables. The first shows the variable name. The second, Delta%, shows the maximum difference between the two series for each variable. The third and fourth columns, “First” and “Last”, give the date (or observation number) of the first period in which the two series differ and the last period in which the two series differ. Here, the first period in which M_0 differs from M_1 is 1960Q1, and the last period in which they differ is 1999Q4.


