Interpolate
The interpolation procedure for a series fills in missing values, or NAs, within a series by interpolating from values that are non-missing. EViews offers a number of different algorithms for performing the interpolation: Linear, Log-Linear, the Catmull-Rom Spline, and the Cardinal Spline.
The Linear interpolation method simply computes a linear approximation based on the previous non-missing value and the next non-missing value. The interpolated value is then calculated as:
 | (11.30) |
where

is the previous missing value,

is the next non-missing value, and

is the relative position of the missing value divided by the total number of missing values in a row.
Thus if you have a single NA, then the interpolated value will be half way between the previous value and the next value. If you have two NAs in a row, the first will be interpolated as 1/3 of the distance between the previous value and the next. The second value will be interpolated as 2/3 of the distance.
Log-linear interpolation is calculated in the same way as the Linear method, but the series values are logged before the calculation is made, then the interpolated value is exponentiated. If the source series contains negative values before and after the missing values, then the absolute value is used for interpolation, with the result being negated. If the values to either side of the missing values contain both a negative and a positive number, the interpolation routine will return an NA. Thus the interpolated value is calculated as:
 | (11.31) |
 | (11.32) |
Note that both the linear and log-linear routines will return an NA if there are no previous or next non-missing values available – i.e. if the first observation in the sample is an NA, it will not be interpolated since there is no previous value available.
The Cardinal Spline is based on the previous two non-missing values, and the next two non-missing values, and tries to fit the missing data to a non-linear, or curved, pattern. Denoting
and

as the previous two non-missing values, and

and

as the next two non-missing values, the interpolated value is calculated as:
 | (11.33) |
where

is a called a tension parameter and affects the curvature of the spline.
The Catmull-Rom Spline is a special case of the Cardinal Spline, with the tension parameter,

, set at 0.
Note that as with the linear and log-linear routines, both spline routines will return an NA if either
or

are missing. However if

is missing, it is simply set equal to

, and if
is missing, it is set equal to

.
For example, the following series is interpolated using Linear and Log-Linear interpolation:
| | | | | |
1 | -1 | -- | -1 | -1 | -1 |
2 | -0.8 | -- | -0.8 | -0.8 | -0.8 |
3 | NA | 1/2 | -0.6 | -0.56569 | -0.4750 |
4 | -0.4 | -- | -0.4 | -0.4 | -0.4 |
5 | NA | 1/3 | -0.66667 | -0.56769 | -0.60741 |
6 | NA | 2/3 | -0.93333 | -0.83203 | -0.90370 |
7 | -1.2 | -- | -1.2 | -1.2 | -1.2 |
For this series, the first missing value is at observation 3. The linear interpolation of this value is simply 1/2 of the value of observation two (the previous non-missing observation) plus 1/2 of the value of observation four (the next non-missing observation), i.e. 1/2*-0.8 + 1/2*(-0.4). The second missing value is at observation five, and is equal to 2/3 of the value of observation four, plus (1-1/3) of the value of observation 7, i.e., 2/3*(-0.4)+1/3*(-1.2). The final interpolated value, at observation six, is calculated as 1/3*(-0.4) + 2/3*(-1.2)
For log-linear interpolation, the calculated value for observation three is equal to the negative of the exponent of 1/2 of the logged value at observation two (negated since it is negative) plus 1/2 of the value of observation five (negated):
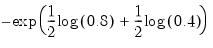 | (11.34) |
The calculations for observations five and six, respectively, are:
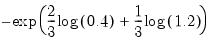 | (11.35) |
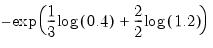 | (11.36) |
For the Catmull-Rom spline, the calculated value for observation three is equal to:
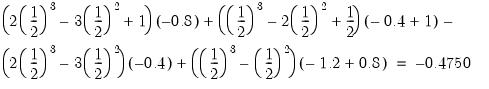 | (11.37) |
The values at observations five and six are calculated similarly, although note that both for both observations,

and

are equal to -1.2.
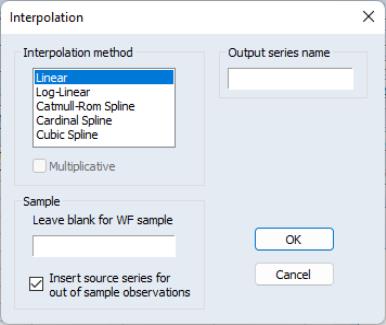
To perform interpolation from within EViews, open up the series, then click on which will open up the dialog. The Ibox lets you select which interpolation method you would like to use.
The box lets you enter a name for the output series in which the interpolated values will be stored. If left blank an untitled series will be created.
The box lets you select a sample over which the interpolation will run. If left blank, the default workfile sample will be used. Note that observations outside of the selected sample will not be interpolated, nor will they be used as part of the interpolation calculations. The checkbox labeled controls whether the output series will be filled with the source series values for out of sample observations, or will be filled with NAs.