Indicator Saturation
Traditionally, the analysis of outliers and structural breaks in regression analysis was conducted by testing the statistical significance of a parsimonious, predetermined set of related indicator variables. More recently, advances in computing power and the development of general-to-specific (GETS) modeling permit testing of indicators at each observation in the estimation sample.
The indicator saturation approach is an extension of least squares regression for testing for outliers and structural breaks in a regression specification. The indicator saturation approach works by including indicator variables for outliers or structural breaks at every observation in the regression, and then employing the GETS algorithms to select which of the included variables should be retained in a final regression model.
Note that inclusion of indicators at each observation would ordinarily be prohibited due to the singularity of the regressor matrix, but the introduction of block estimation in GETS modeling
“Auto-Search / GETS”, allows testing of indicators throughout the estimation sample.
In EViews, you may perform indicator saturation on simple linear equations (which do not include ARMA terms) estimated using least squares. EViews offers testing for three different indicator types at each period t:
• : a dummy variable equal to zero everywhere other than a single value of one at period t. This indicator is equivalent to the @isperiod function used at the date corresponding to t.
• : a step function variable equal to zero until t and one thereafter. This indicator is equivalent to the @after function used at the date corresponding to t.
• a trend-break variable that is equal to zero until period t and then a follows a trend afterward. This indicator is equivalent to the @trendbr function used at the date corresponding to t.
(Note that an SIS indicator at
t and

is numerically the same as an IIS indicator at
t. Similarly, a TIS indicator at
t and

is numerically identical to an SIS indicator at
t. For this reason, when testing for these combinations of indicators, EViews will automatically drop the numerically equivalent variables.)
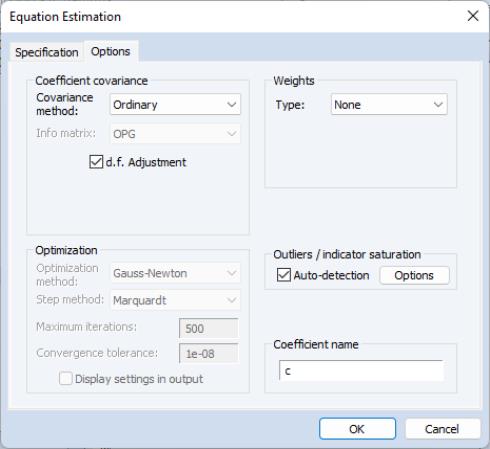
To instruct EViews to detect indicators in your least squares regression, open the equation estimation dialog, enter your least squares specification in the edit field, and select in the dialog. Next, click on the Options tab to display the dialog:
Select the check box in thearea on the right-hand side of the dialog, and then press the tab to bring up the dialog:
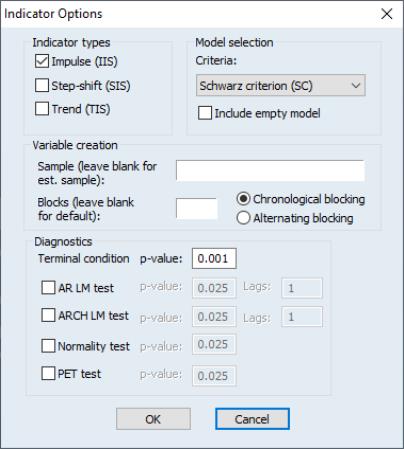
There are a number of settings which control the indicator saturation analysis:
• The section allows you to specify which type of indicator you would like to detect. You may individually choose to test for , , and indicators by selecting the corresponding checkbox.
• In the area, the dropdown specifies the information criteria used to select the final model from the candidate models. The I check box specifies whether to the empty model (with no indicators) as possible a possible candidate model.
• The edit field in theea allows you to specify a different set of dates over which to create the indicators. By default, the estimation sample is used, but you may enter a different sample if desired.
• The edit field allows you to specify the number of blocks the indicators will be split into. Since the number of indicators will exceed the number of observations, indicators will be added in blocks. EViews will automatically determine the optimal number of blocks, but you may enter your own choice in this field to override the EViews default.
The and radio buttons determine whether the indicators are split into blocks in chronologically (the first group of dates in the first block, followed by the next group in the second block and so on), or alternating (the first date in the first block, second date in the second block and so on).
• The set of options allows selection of which indicator saturation diagnostic tests to include along with their p-values. You may perform (autoregressive LM), , , and the (Parsimonius Encompassing Test) testing. For the test andtest, you should specify the number of lags to include.
Once an equation has been estimated with indicator saturation variables, a new post-estimation diagnostic is available from the menu. Select to display a summary of the indicators that were included, and, if any were detected, produces a chart of the trajectory of the indicators through time.