Modifying Multiple Graphs
Some views are made up of multiple graphs. Like single graph views, these multiple graph views may be turned into graph objects by freezing. For example, the impulse response view of a VAR can display multiple graphs in a single view.
You may also create a graph object containing multiple graphs by combining existing named graph objects. Simply select the desired graphs and then double click on any one of the highlighted names. An alternative method of combining graphs is to select and enter the names of the graphs.
There are two ways to work with a multiple graph. You may change the settings for the multiple graph as a whole, or you may work with an individual graph component of the multiple graph.
Working with Multiple Graphs
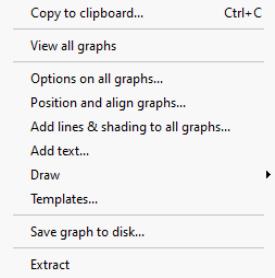
EViews makes it easy to work with all of the graphs in a multiple graph. Simply select from the graph menu or click on the background of the graph and display the right mouse-button menu. EViews will display a menu prompting you for additional choices.
Note that selecting will display a menu with additional options related to auto updating of graphs. See
“Freezing a Graph View” for a discussion of graph updating.
These menu items set options that apply to all graphs in the graph object.
• copies the graph to the clipboard.
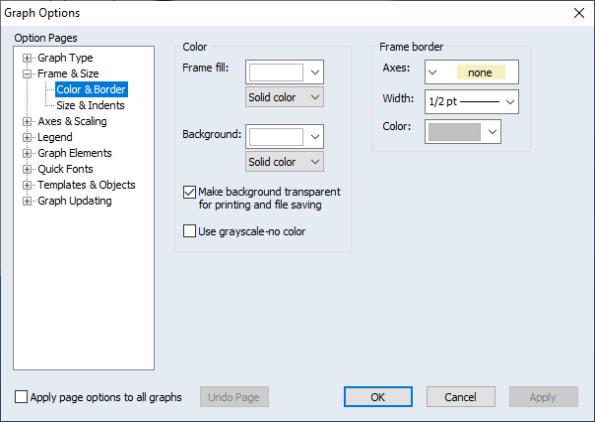
• To set a common graph attribute to all graphs, select . EViews will display the multiple graph version of the dialog, with each page initialized using the settings for the first of the multiple graphs. Here we see the dialog open to the page of the section:
Click on to accept and apply the changes to each of the graphs.
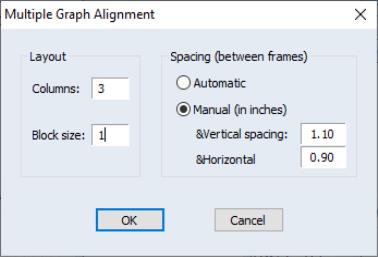
• Each single graph in a multiple graph may be positioned freely by dragging the graph. Alternately, you may wish to align graphs in columns and control the overall spacing between graphs; for quick positioning all of your graphs, select to open the graph alignment dialog.
You may choose the number of columns and blocksize, as well as the horizontal and vertical spacing around individual graphs.
Here, we instruct EViews to display the graphs in blocks of 5, positioned using 3 columns per row. In this example, the first row of a block will contain 3 columns while the second row will have 2 columns; the pattern is repeated as necessary. If the specified blocksize is less than the number of columns, the “effective” blocksize will be the smallest multiple of the blocksize greater than the number of columns. Specified 3 columns with a blocksize of 2 is equivalent to 3 columns with a blocksize of 4.
Note also that when the dialog opens, the current spacing settings will be specified in the manual alignment edit fields. To have EViews automatically reposition the graphs (which may be useful if, for example, you have changed aspect ratios or font settings), select and click on .
• If all of your graphs share a common axis, you can draw lines or add shading to each graph in the object, by selecting .See
“Adding Lines and Shades”.
• Selecting allows you to annotate your multiple graph. Note that adding an item to the multiple graph differs from adding it to an individual graph since it will not move as you move individual graphs within the multiple graph. See
“Adding and Editing Text”.
• Selecting allows you to apply a template graph to each individual graph in your multiple graph or to reset the graph to use the global defaults. See
“Templates” for a discussion of templates.
Working with Individual Graphs
You may change the options for a single graph within a multiple graph in the usual fashion by double clicking on the single graph to display its options dialog.
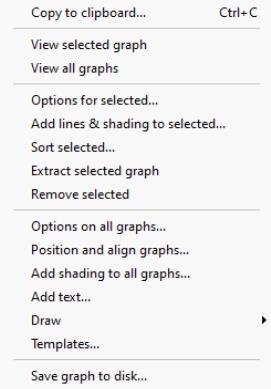
You can also perform various operations on individual graphs. Click on the individual graph and EViews will confirm the selection by surrounding the graph with a blue border. Select or right mouse click to display a menu that combines the individual and multiple graph choices.
Most of the menu items are taken from the multiple graph menu, and apply to the entire graph. For example, selecting allows you to copy the entire graph to the clipboard, not the individual graph.
The middle set of items provide tools for working with the selected graph. You may use these to change options, to add lines, shading, or text, draw rectangles or ellipses, to sort the data, or to extract or remove the selected graph.