Animated Graphs
Static graphs display data for a fixed range of observations. That range may consist of a single observations or multiple observations, but it does not change. With animated graphs, you may dynamically adjust the range of data be displayed to highlight data changes as we move through observations in the workfile.
An animated graph is nothing more than multiple static graphs displayed one after another. To animate a graph, the axis range, data range, or both, must change. EViews offers easy-to-use tools for describing how these changes occur over the course of the animation with presets for commonly encountered forms, and custom settings for general types.
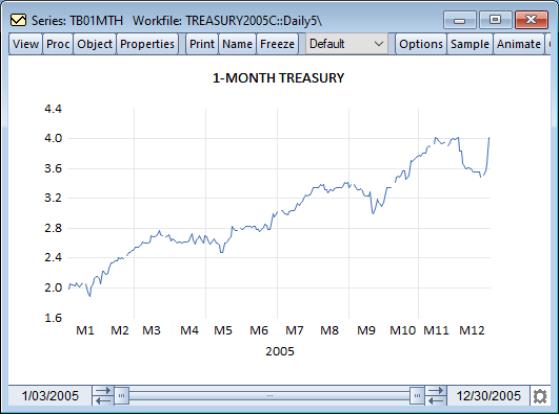
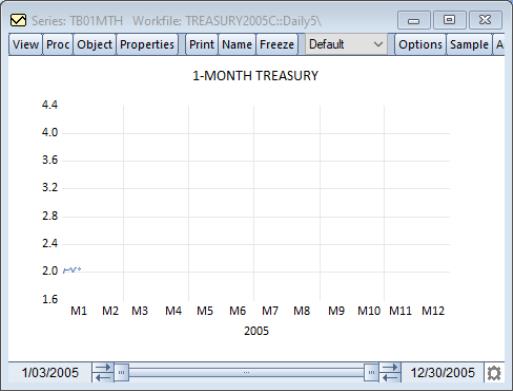
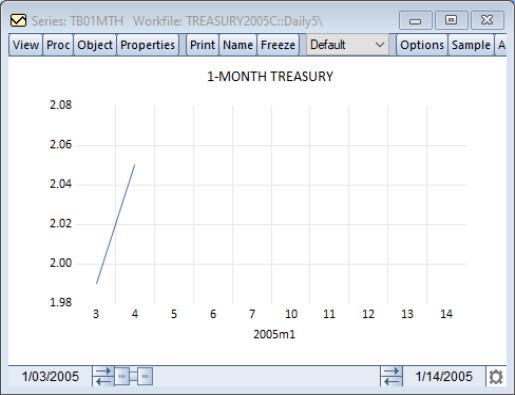
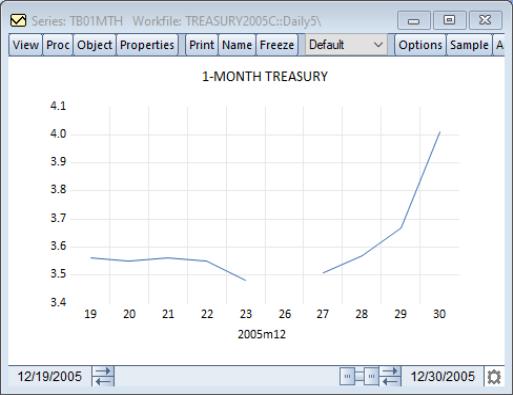
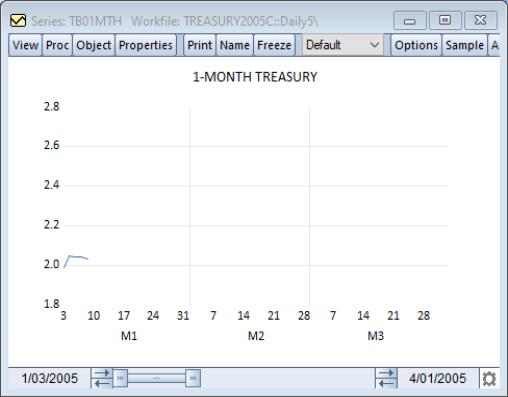
Using the “Treasury2005c.wf1” located in your Example Files directory, a typical line graph of the 1-Month Treasury bond rate (tb01mth) would appear as:
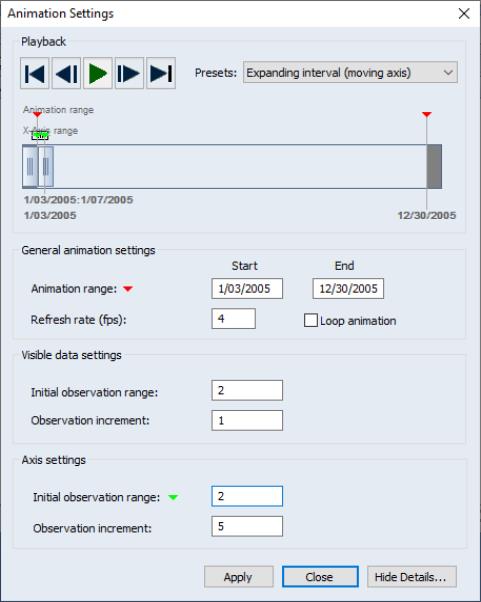
With the use of animated graphs, you can view how the bond rate display changes as a function of time. To do so, press the button in the toolbar and the animation dialog will appear.
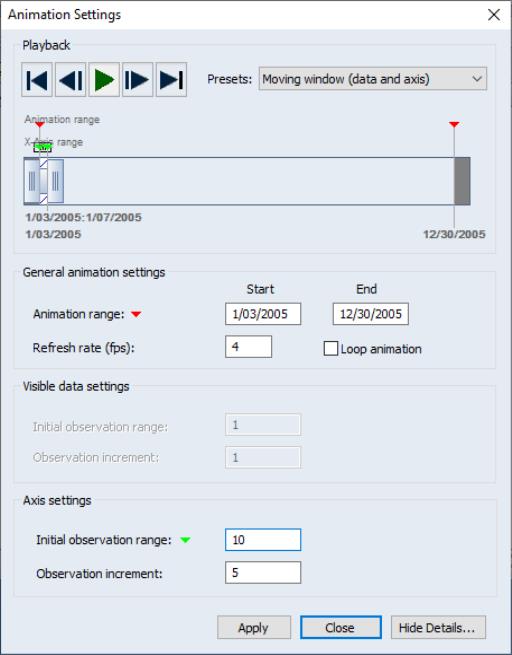
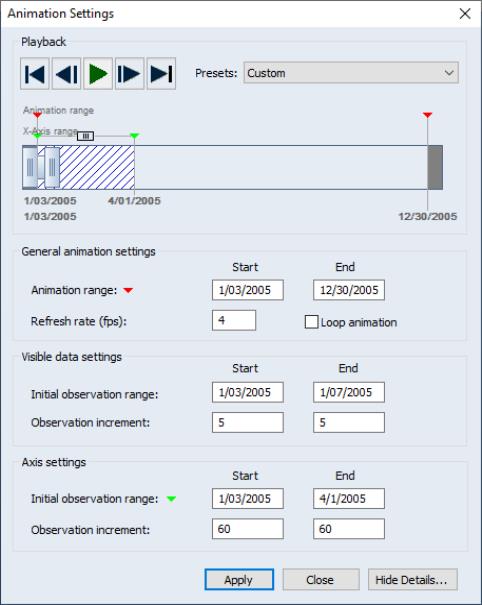
At the top of this dialog is the control area. Here you will find 5 buttons: jump to animation start (first frame), move to previous frame, play/pause animation, move to next frame, jump to animation end (last frame). To the right of the control buttons is the combo box. Here is where you can choose from a list of predefined animation types. Details on these types will be discussed later.
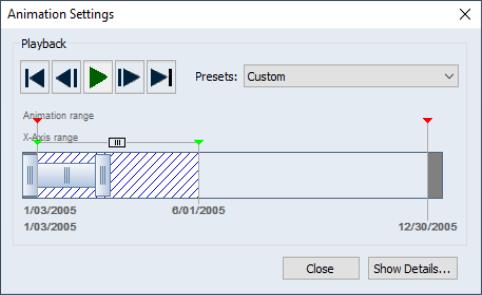
At the bottom of the section is the animation viewer. The viewer shows a schematic view of the relationship between an individual animation frame and the entire animation sequence. Within the viewer, there are three distinct components:
• The animation range specifies from observation from where the animation should start and to the observation where should end. The animation range is denoted by the red arrows located at the top of the viewer (just under the text “Animation range”). A text representation of the range can be found at the very bottom of the viewer and beneath the corresponding red arrow.
In this example, the animation range is from 1/03/2005 to 12/30/2005.
• Just below the animation range arrows (just under the text “X-Axis range”) are green arrows denoting the X-axis range of observations displayed in the current frame. The text representation of the axis range can be found above the animation range text, and just below the horizontal viewing box.
Here, the X-axis range is from 1/03/2005 to 6/01/2005.
• In the center of the viewer are two vertical rectangular boxes. These boxes represent the ends of the data range showing the observations that are currently being viewed within the axis range.
In this case, the data range is 1/03/2005 to 2/24/2005, which is a bit shy of half of the axis range.
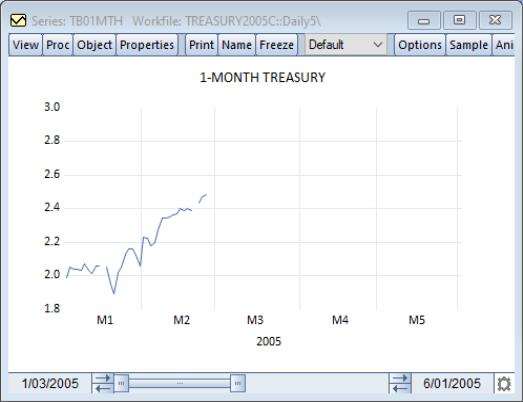
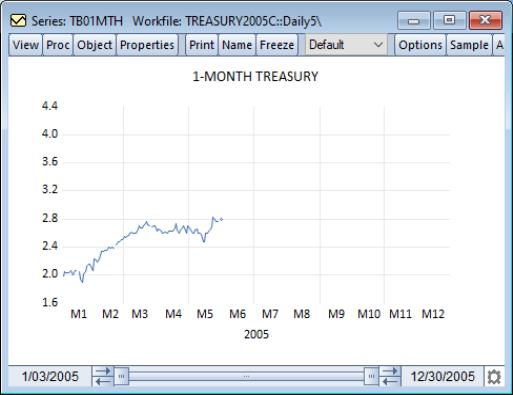
At these settings, the graph display will be
You may modify all of these settings interactively:
• You may click and drag the red arrows to alter the start and end of the animation range (note that you are limited to areas outside the axis range).
• You may click and drag the green arrows to change the axis range (note that you are limited to moving within the animation range and outside the data range).
• You may click and drag the vertical boxes on the ends of the data range to expand or contract the range of visible observations (note that you are limited to moving within the current axis range).
• You may drag the bar connecting the two vertical boxes to slide the position of the data range to show a different set of observations within the axis range.
You may also, as outlined below, use various edit fields to define these ranges. Clicking on the button will display a preset-specific dialog with settings for these ranges and other animation settings.
The animation range defines the space in which the animation occurs. The X-axis and data ranges, and how they change over time, control the movement of the data display through the course of the animation.
Notably, the visible data range may, as the animation proceeds:
• from the initial data range, expand or contract in size (expanding/contracting window)
• be of fixed width and move across observations (moving window)
• be of varying width and move across observations (expanding/contracting and moving window)
Similarly, the X-axis range may, as the animation proceeds:
• be fixed at a given pair of observations (fixed window)
• from the initial X-axis range, expand or contract in size (expanding/contracting window)
• be of fixed width and move across observations (moving window)
• be of varying width and move across observations (expanding/contracting and moving window)
Notice that the last three animations for the X-axis range are the same as those for the visible data range.
In general, the process of specifying these different animation types is quite straightforward, as EViews offers easy-to-use presets which take most of the work out of defining your animation type.
Animation Graph Presets
EViews offers presets that simplify specification of several popular types of animation. You may use the combo to select between:
• , where the data range grows within a fixed X-axis
• , where a fixed-length data range (window) slides along the X-axis
• , where a data range grows within an X-axis until it fills the X-axis, then the X-axis moves, and the process is repeated
• , where you have complete control of the animation settings.
In the following sections, we consider each of these settings in additional detail.
Expanding Interval (Fixed Axis)
Perhaps the simplest animation setting is the preset in which the data range grows within a fixed X-axis. This setting takes an initial data range and adds observations until the data range reaches the end of the fixed X-axis range.
Select the entry from the dropdown to display the dialog. Click on to display the full set of settings.
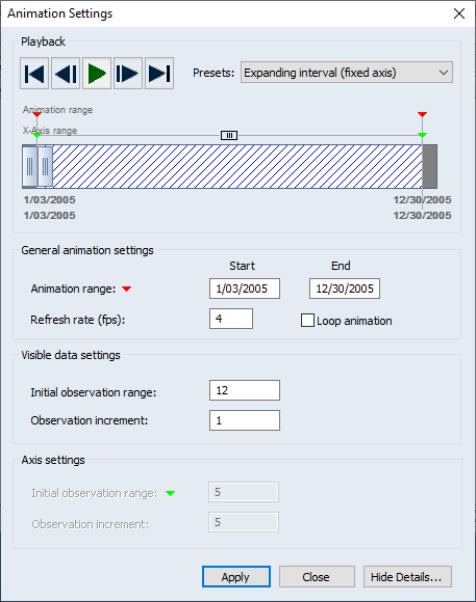
Just below the animation viewer is the groupbox. There are three controls in this group: the where you set the bounds for the animation window, the which determines the number of different graph frames displayed per second, and a checkbox for whether the animation should repeat until deliberately paused.
Here, we have the animation range for this graph set to the full workfile range (January 1 to December 31, 2005). There will be 4 frames displayed per second, and the animation will pause when the initial run through the data is completed.
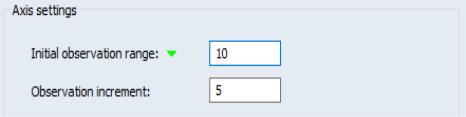
The remaining settings control the initial data range and the expansion of the range. The indicates how many observations will be displayed at the start of the animation, and the controls how many observations will be added to the end of the data range with each update.
Notice that the groupbox entries are disabled in this preset since the X-axis range is always equal to the animation range (this is what is meant by a fixed axis graph).
In this example, we begin with a display of the first 12 observations (January 3–18, 2005).
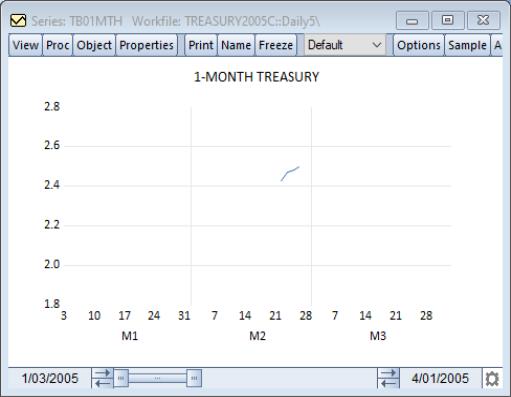
As the animation runs, one observation will be added to the end of the data range for each frame until the data range matches the animation (and X-axis) range. After several frames
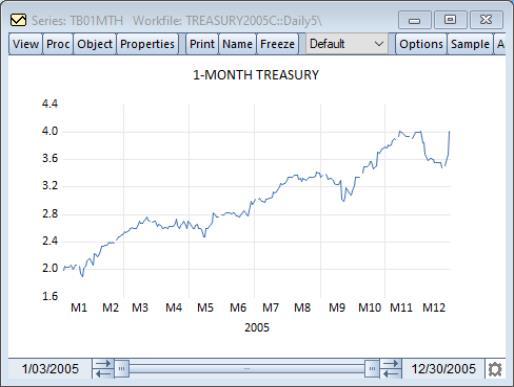
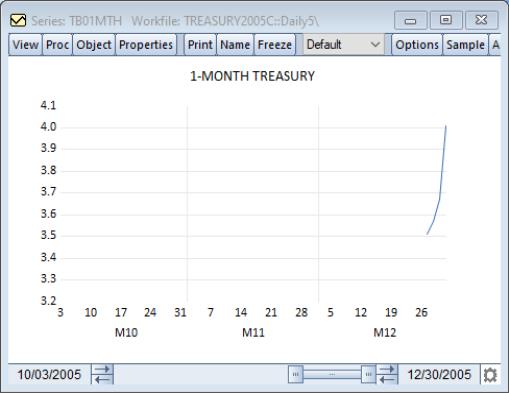
and at the end of the animation, we have
which shows the full set of data in the animation window.
Moving Window
Thepreset may be used to specify animation where a fixed-length data range and associated X-axis (window) moves or slides along the animation window. This preset is well suited to showing snapshots of data graphs through time, as in a slideshow.
If you switch the to , and clicking on , the dialog will change to:
As before, the groupbox includes the where you set the bounds for the animation window, the which determines the number of different graph frames displayed per second, and a checkbox for whether the animation should repeat until deliberately paused.
Next, notice that the groupbox entries are disabled in this preset since the data range is always the same as the visible X-axis so that the data range size is fixed by the X-axis .
The section controls two things: the number of observations that are visible at the onset of the animation (), and the number of observations to move (slide) the X-axis () with each step in the animation.
Here, the animation begins with the first 10 observations visible
Since this example uses a daily-5 workfile, we see a two week's worth of data. In each animation step, the axis will advance by 5 observations as specified in the edit box and the data range will be updated to match. Since the width of the data frame and axis are set by the initial range, we will continue see two week's worth of data, with a one week data overlap with the previous animation frame.
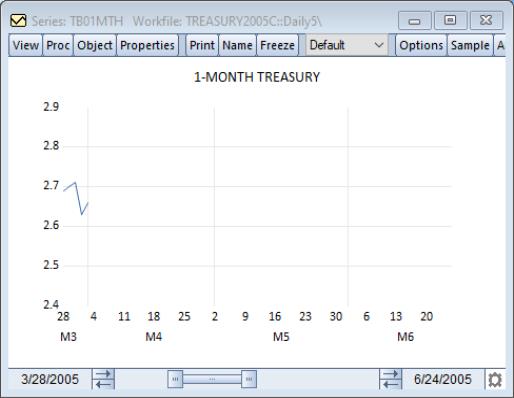
The second frame of the animation overlaps the first by 5 days (one week), with the first week of the second frame duplicating the second week of the first frame:
The process continues until the X-axis we reach the end of the animation range. The last frame of the animation will contain the last two weeks of data:
Expanding Interval (Moving Axis)
The combines the behavior of the two previous presets. Here we have a data range that starts from an initial size and grows within an X-axis (as in
“Expanding Interval (Fixed Axis)”) until it fills the X-axis, then the X-axis moves (as in
“Moving Window”). When the X-axis moves, the data range is reset to its initial size, and the process is repeated.
Change the to and click on , to display the expanded dialog:
As noted before, the edit field sets the bounds for the animation window, the which determines the number of different graph frames displayed per second, and a checkbox controls whether the animation should repeat after reaching the end.
The remaining settings should be familiar from previous presets:
• act as in the previous discussion of expanding intervals (
“Expanding Interval (Fixed Axis)”). The indicates how many observations will be displayed at the start of the animation and after an axis move, and the controls how many observations will be added to the end of the data range with each update.
• The act as in the previous discussion of moving window animation (
“Moving Window”). There are two controls: the number of observation in the X-axis that is visible at the onset of the animation (), and the number of observations to move (slide) the X-axis () with each step in the animation.
Putting the two sets of settings together in a single preset allows us to have both an expanding data intervals within an X-axis frame, and an X-axis frame that moves to the next position when filled:
• At the start of the animation, we see a frame showing the X-axis of size given by the in the . The number of visible data observations will be given by the in the .
• In each subsequent animation frame, the observations will be added to the end of the visible data range using the number given in the in the .
• Once the visible data range reaches the end of the current X-axis range, the X-axis will move using the number given in in the .
The process repeats until we hit the end of the animation window.
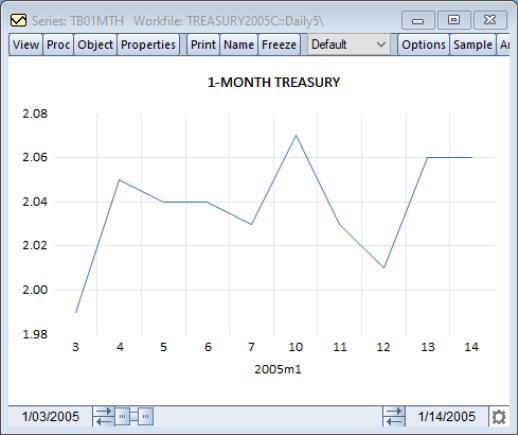
The settings depicted indicate that the animation starts with the X-axis showing 10 observations (January 3–14, 2005) at the beginning of the animation window. Within this window, there will be a graph showing the first 2 data points.
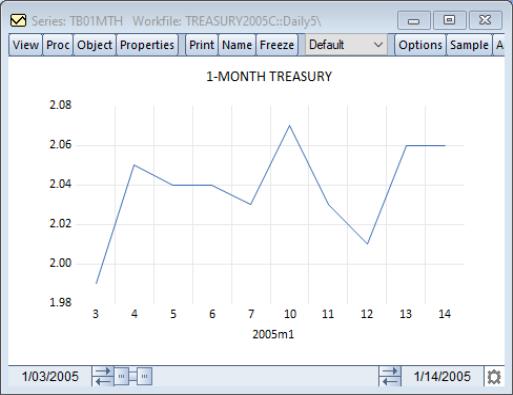
As the animation runs the data range will expand until it reaches the end of the visible X-axis,
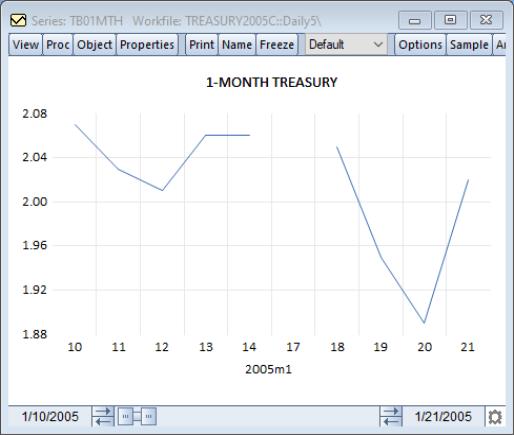
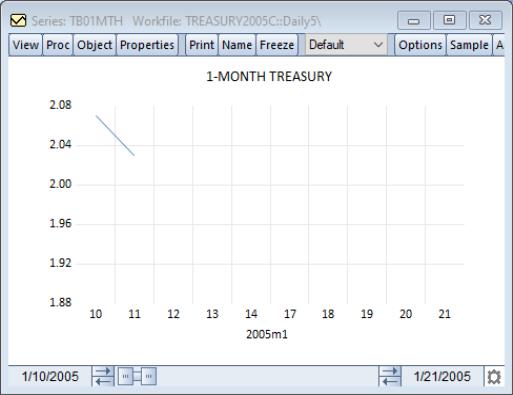
In the next animation frame, the X-axis moves the 5 observations (overlapping with the previous axis) and the data frame resets to the initial two observations
at which point the process repeats with the X-axis moving as necessary.
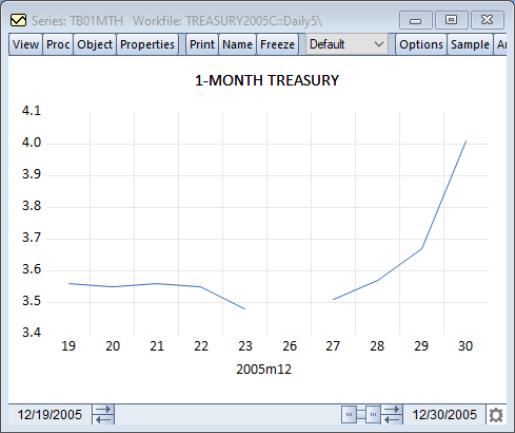
The final animation frame show the last X-axis with the full data frame showing all of the corresponding observations.
Custom
We fully anticipate that the animation presets will satisfy the overwhelming majority of your animation needs. For those cases where you require a bit more flexibility than afforded by the presets, EViews offers a custom setting in which you can fine tune your animation by setting specific initial ranges and by controlling the changes in range start and end increments for each animation frame.
Change the to and click on , to display the custom settings:
The available and differ from the presets offerings. Note specifically that the custom settings allow for:
• data and X-axis range start and ends to be specified directly
• data and X-axis range start and end increments to differ in very general ways
Before proceeding, it may be helpful to consider the values of these settings in the context of the presets:
• The preset sets the initial X-axis range to be the animation range. Since the X-axis does not change, the axis start and end increments are 0. The initial data range is set from the start of the animation range to the number of initial observation. The data range start increment is 0, and the data range end increment is the specified observation increment.
• The preset sets both the initial X-axis and data range to be from the start of the animation range to the specified initial observation range. All of the increments (X-axis and data; starts and ends), are set to the specified observation increment.
• The preset sets the initial X-axis range to be from the start of the animation range to the axis initial observation. Within the X-axis range, the initial data range is from the start of the animation range to the data initial observation. The data range start increment is 0, and the data range end increment is the specified data observation increment. The axis start and end increments are both set to the axis observation increment.
Two brief observations: both of the expanding interval presets have data start increments of 0, and end increments specified by the user; both of the presets with moving axes have axis start and end axis increments and the one preset with a moving data window has data start and end increments that are the same.
By freeing up these restrictions, the flexibility afforded by the setting allows for custom effects such as:
• data window movement, (stepping), within a moving axis
• variable size (growing or shrinking) moving axes
• contracting data ranges
To illustrate, we consider examples of these effects.
Moving Data Window Within Moving Axis
The allows the data window to grow until the X-axis is filled, followed by an X-axis step. Suppose instead that we wish the within axis display to show non-overlapping sets of data, stepping through the axis.
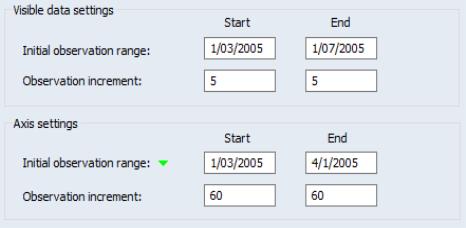
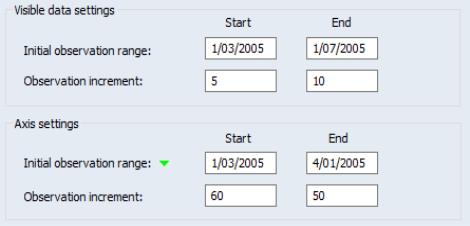
To achieve this effect, we specify that define a moving axis window as before (albeit using a specific initial observation range), with start and end increments that are equal to the size of that range. We also use the flexibility of the custom options to define a moving data window by choosing the so that the start and end increments are the same, and equal in size to the observations in the initial range:
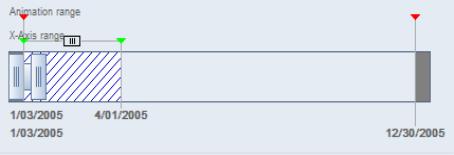
In the , we set the start and end to Monday January 3rd to Friday January 7th. For the : we set both the start and end to 5. Since this is a daily-5 workfile, every frame will advance the start to the next Monday and the end to the next Friday,. We also set the axis range from January 3 to April 1. Once the data end reaches the axis end, the axis range will then advance 60 observations (one quarter). The viewer shows the basic setup
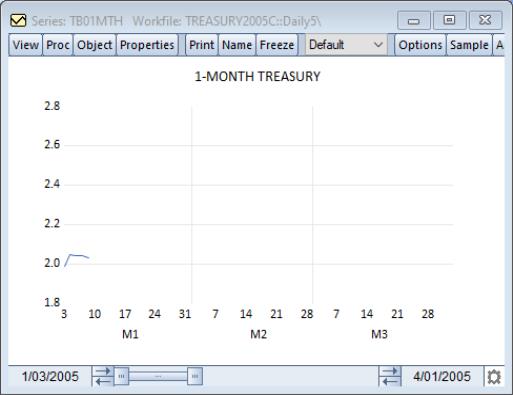
At first the graph will appear as:
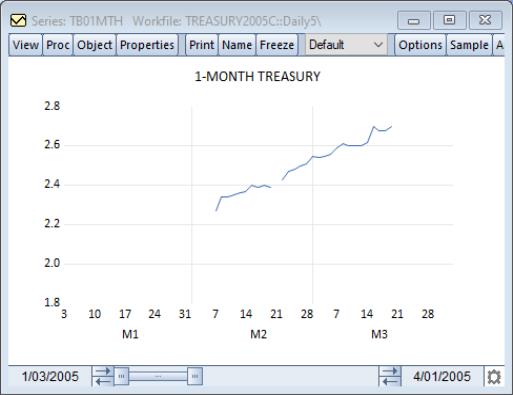
Eventually the graph will progress to:
and just after the frame moves, we have
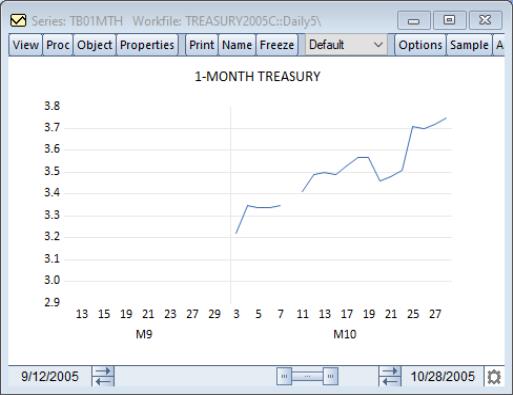
At the end of the animation, we have the final axis window, and the final data window within that axis window:
Variable Width Moving Data Window Within Variable Width Moving Axis
Bulding upon the previous example, we may make both the moving data window and the moving axis variable-width by altering the start and end increments. For example,
has where the start increment is less than the end increment, and where the start increment is greater than the end increment. Since the start increments are non-zero, both the data and axis will have moving windows. The data windows will have an initial size of 5 observations and will grow by 5 observations each frame as they move through the axis frame. The X-axis will have 90 observations at the start of the animation, and since the start step is greater than the end step, will shrink by 10 observations in each subsequent axis move.
The initial graph is as in the previous example:
Five frames in, the visible data range has increased by 25 observations
By the end of the animation, we have
Notice that the X-axis range is smaller than in its initial condition, having decreased in size with each axis move.