Spreadsheet
This view displays the data, in spreadsheet form, for each series in the group. If you wish, you can flip the rows and columns of the spreadsheet by pressing the button. In transpose format, each row contains a series, and each column an observation or date. Pressing the button toggles between the two spreadsheet views.
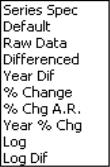
You may change the display mode of your spreadsheet view to show various common transformations of your data using the dropdown menu in the group toolbar. By default, EViews displays the original or mapped values in the series using the formatting specified in the series (). If you wish, you can change the spreadsheet display to show any transformations defined in the individual series (), the underlying series data (), or various differences of the series (in levels or percent changes), with or without log transformations. Note that date formats are not applied to the displayed data if you select . Annual-based transformations for daily and weekly data was removed in EViews 13.
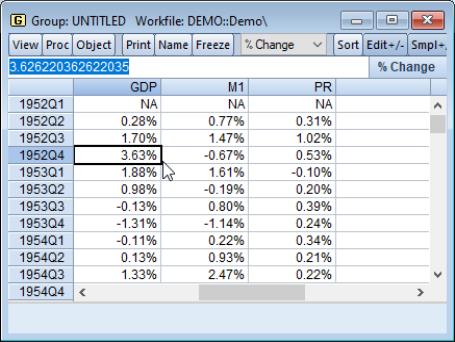
You may edit the series data in either levels or transformed values. The on the group toolbar toggles the edit mode for the group. If you are in edit mode, an edit window appears in the top of the group window and a double-box is used to indicate the cell that is being edited.
Here, we are editing the data in the group in 1-period percent changes (note the label to the right of the edit field). If we change the 1952Q4 value of the percent change in GDP, from 3.626 to 5, the values of GDP from 1952Q4 to the end of the workfile will change to reflect the one-time increase in the value of GDP.
Additional Customization
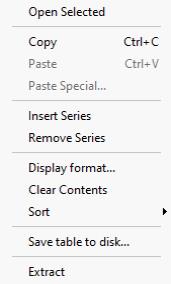
EViews provides you with additional tools for altering the display of your spreadsheet. To change the display properties, select one or more series by clicking on the series names in the headers, then right-click to bring up a menu.
will open a new group object containing the selected series in a new, untitled group.
You may use the and entries to change the contents of the current group.
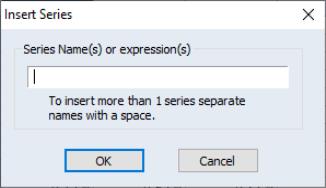
Selecting brings up a dialog which allows you to insert multiple series by simply entering their names or series expressions. The new series will be inserted after the currently selected series and all subsequent series will follow the newly inserted series. works slightly differently, in that no dialog will be shown and all selected series will be removed from the group. (See also
“Group Members” for an alternative method of changing the group contents.)
If the current ordering of the series is not desired, you may change the order by dragging a series to the desired position. Dragging is achieved by first selecting one or more series. Once the selection has been made, move the mouse to either the left edge of the first selected series or to the right edge of the last selected series. Once over the edge, the cursor should change to the cursor shown in the following image. From here, press the left mouse button and drag the series to the desired location.
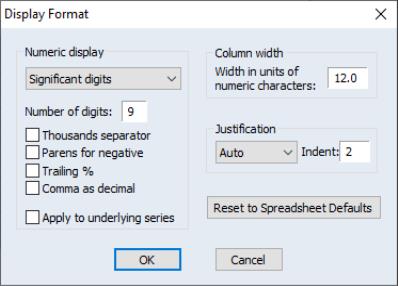
If you right-click and then select EViews will open a format dialog that will allow you to specify group display characteristics that override the individual series display characteristics. Once you specify the desired format and click on , EViews will update the group display to reflect your specification.
Note that, by default, changes to the group display format will apply only to the group spreadsheet and will not change the underlying series characteristics. If, for example, you elect to show series X in fixed decimal format in the group spreadsheet, but X uses significant digits in its individual series settings, the latter settings will not be modified. To update the display settings in the selected series, you must select the checkbox in the format dialog.
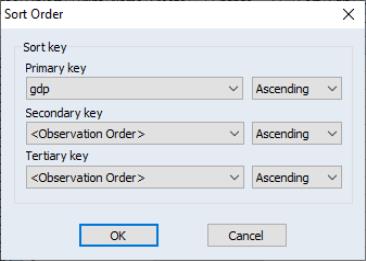
You may display the observations in the group in sorted order using the menu item in the right-mouse menu. EViews will open the Sort Order dialog, prompting you to select sort keys and orders for up to three series.
When you click on , EViews will rearrange the group spreadsheet display so that observations are displayed in the specified order.
A quicker alternative, assuming you only want to sort by only one series, is to use the right-mouse button menus. Selecting or sorts the observations using the first selected column of data.
Note that the underlying data in the workfile is not sorted, only the display of observations and observation identifiers in the group spreadsheet. This method of changing the spreadsheet display may prove useful if you wish to determine the identities of observations with high or low values for some series in the group.
Selecting sets the selected observations and variables to NA.
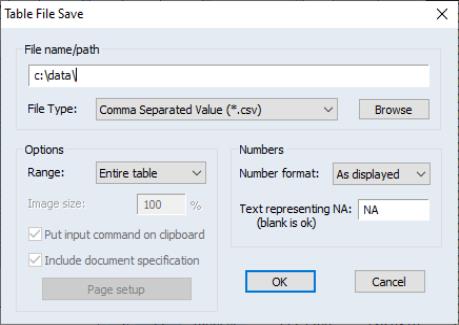
Lastly, you should note that as with series, you may write the contents of the spreadsheet view to a CSV, tab-delimited ASCII text, RTF, or HTML file by selecting and filling out the resulting dialog.
It is worth pointing out that if you select a set of specific cells in the group spreadsheet and then right-click, you will be presented with a slightly different menu that, among other things, allows you to copy the contents, insert, or delete observations.
creates a new table object containing the contents of the group spreadsheet.
Group Comparison Tools
EViews offers tools so that you may compare the data between the series in your group. When looking at the view of the group, simply press the button on the toolbar to enter Compare mode. Compare mode will behave differently depending upon whether there are only two series in the group, or more than two.
In both cases the main feature of compare mode is that it will highlight, in red, any observations for which the series in the group have different values. This can be useful when comparing revisions to series in order to quickly find for which observations any revisions or changes have been made.
By default the comparison of the series is done with zero tolerance - even the slightest difference will cause EViews to highlight the row. You can change this tolerance level by right clicking anywhere on the spreadsheet when in compare mode and selecting the item. This will bring up a dialog that allows you to change the tolerance level by changing the number in the box.
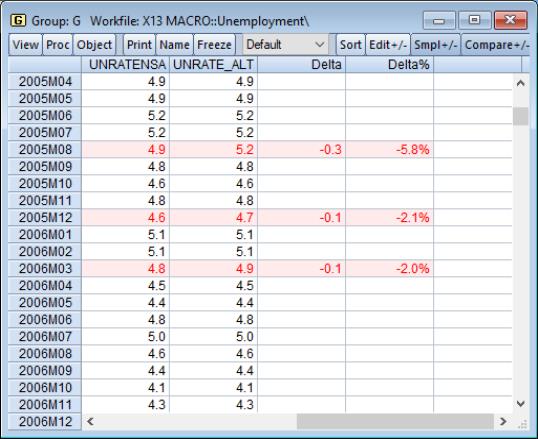
With only two series in the group, compare mode will also show additional columns containing information on how much the data in the two series differ. The following example shows compare mode being used on two series, UNRATE and UNRATE_REV, in the group G:
We are able to quickly see that there are three observations for which the two series differ: 2005M08, 2005M12 and 2006M03. Compare mode has added two columns to the spreadsheet, one containing “Delta”, which shows the raw difference between the two series (UNRATE - UNRATE_REV), and the second containing “Delta%”, which is the percentage difference ((UNRATE-UNRATE_REV)/UNRATE_REV). Note that for ease of use, in cases where there is no difference between the two series, the Delta and Delta% columns are left blank instead of showing “0”.
All four of these columns is fully editable. A quick way to remove any difference between the two series is simply to type a “0” into the Delta column (or simply delete a value in it). Similarly, a quick way to make UNRATE equal to 10% higher than UNRATE_REV is to type “10” in the Delta% column. Note that when editing Delta and Delta%, the change is made to the first series (UNRATE in our case), and not the second
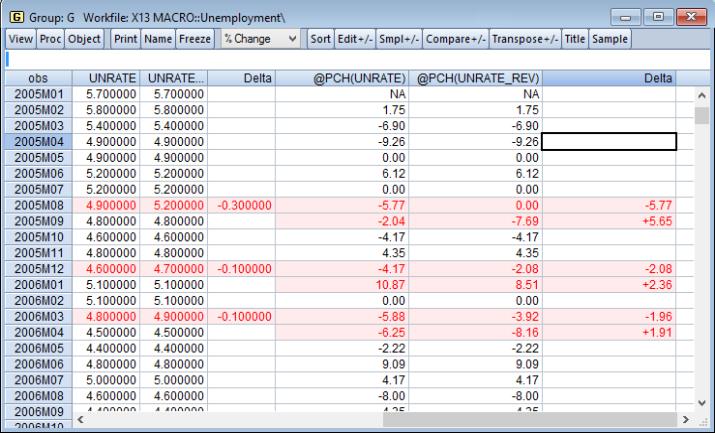
If you change the display type of the group to a setting other than “Default” or “Raw data”, rather than replace the raw series values with the transformation you selected, EViews will remove the “Delta%” column and introduce new columns containing the transformation, and a new “Delta” column containing the difference for that transformation. For example, if we switch the display type of our group to “”, the compare view will contain 6 columns of data - the original UNRATE and UNRATE_REV series, the “Delta” column for those two series, an @PCH(UNRATE) column (containing the percentage change for UNRATE), an @PCH(UNRATE_REV) column (containing the percentage change for UNRATE_REV), and finally a “Delta” column containing the difference between the two percentage change columns:
Again, each of these columns is editable. For example, a quick way to ensure that the two series grow at the same rate, even if they start at different values, is to enter a “0” in the “Delta” column for the @PCH columns after that date.
When your group contains more than two series, compare mode does not add any extra columns to the spreadsheet, and merely provides color highlighting for any columns which have different values. The series in the group will be compared in pairs.
See
Appendix B. “Enhanced Spreadsheet Editing” for a description of array expressions that may be used in editing your data.