Panel Causality Testing
EViews offers panel specific forms of Granger causality tests (
“Granger Causality”).
In panel workfile settings, EViews performs panel data specific causality testing. In these settings, least squares regressions can take a number of different forms, depending upon assumptions made about the structure of the panel data. Since Granger Causality is computed by running bivariate regressions, there are a number of different approaches to testing for Granger Causality in a panel context.
In general, the bivariate regressions in a panel data context take the form:
 | (58.5) |
 | (58.6) |
Where t denotes the time period dimension of the panel, and i denotes the cross-sectional dimension.
The different forms of panel causality test differ on the assumptions made about the homogeneity of the coefficients across cross-sections.
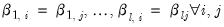
EViews offers two of the simplest approaches to causality testing in panels. The first is to treat the panel data as one large stacked set of data, and then perform the Granger Causality test in the standard way, with the exception of not letting data from one cross-section enter the lagged values of data from the next cross-section. This method assumes that all coefficients are same across all cross-sections, i.e.:
 | (58.7) |
 | (58.8) |
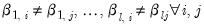
A second approach adopted by Dumitrescu-Hurlin (2012), makes an extreme opposite assumption, allowing all coefficients to be different across cross-sections:
 | (58.9) |
 | (58.10) |
This test is calculated by simply running standard Granger Causality regressions for each cross-section individually. The next step is to take the average of the test statistics, which are termed the

statistic. They show that the standardized version of this statistic, appropriately weighted in unbalanced panels, follows a standard normal distribution. This is termed the

statistic.
(EViews does not provide built-in versions of other panel-causality tests since they are often based upon regressions using some assumptions on
Equation (58.5), or in some cases two-stage least squares regressions, often using a fixed or a random effects model. It is possible to perform these test by estimating the models using an EViews equation object and then perform Wald test coefficient restrictions on the appropriate coefficients.)
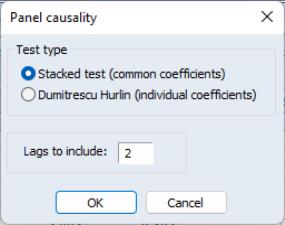
To perform the test, create a group containing the series of interest, then select to display the test dialog:
Select the using the radio buttons and provide a number of . Click on to accept the settings and compute the test.
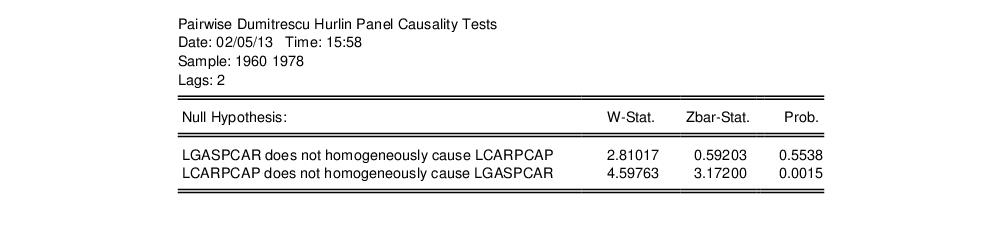
Here we show results for the pairwise Dumitrescu-Hurlin tests using data from “gasoline.WF1” (which is available in your examples directory). We reject the null that LCARPCAP does not homogeneously cause LGASPCAR, but do not direct in the opposite direction.