Outlier Detection
The EViews outlier detection view displays results for several different methods for identifying outliers in your series: Tukey fences, Mean/Standard deviation fences, ARMA outliers, Wavelet outliers.
This view is available in non-panel workfiles.
Tukey Fences
Tukey fences, also known as Tukey's fences or Tukey's range test, were developed by John Tukey (1977). Tukey fences provide a way to define a quartile-based interval beyond which data points are considered outliers.
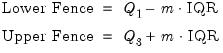
The fences define an upper and lower bound, where any observation lying outside these bounds is determined to be an outlier. The fences are based upon the interquartile range (IQR) of the series (i.e. the difference between the third quartile (

) and the first quartile (

)):
where

is a user-defined constant that determines the range beyond which data points are considered outliers. Typically,

is set to 1.5, but it can be adjusted depending on the specific needs of the analysis. A larger

value will make the method more tolerant of extreme values, resulting in fewer observations being labeled outliers.
Note that Tukey fences may not perform well for trending data since the quartiles do not account for the trend and are calculated over the full sample.
Mean / Standard Deviation Fences
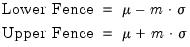
Mean/Standard deviation fences are similar to Tukey Fences, but instead of the bounds being based on quartiles, they are based on the mean (

) and standard deviation (

) of the data:
where

is a user-defined constant. Note that Mean/Standard Deviation fences may not perform well for trending data since the mean and standard deviation are calculated over the full sample and do not account for the trend.
ARMA Estimation Outliers
Chen and Liu (1993) provide a method of detecting outliers in an ARMA process. They consider four different types of outlier effects: Innovational Outlier (IO), Additive Outlier (AO), Level Shift (LS), and Temporary Change (TC).
The Chen and Liu paper describes in detail an approach for iteratively identifying outliers and adjusting ARMA coefficient estimates to account for outliers. The ARMA outlier detection used by EViews uses only the part of Stage 1 of Chen and Liu which:
1. Obtains residuals from preliminary ARMA estimation using the original data.
2. Conducts test for an outlier at each observation using the residuals and standardized test statistics corresponding to the four types of outlier effects. If the absolute value of any of the four test statistics exceeds a specified critical value

, the observation is considered an outlier.
EViews uses the Hyndman and Khandakar (2008) automatic lag selection ARMA estimation procedure, where the model includes a constant and a trend as exogenous variables.
Wavelet Outliers
One particularly important and useful application of wavelets is outlier detection (Bilen and Huzurbazar, 2002). The wavelet outlier procedure is described in great detail in
“Wavelet Outlier Detection”.
Briefly, wavelet analysis approximates the observed series using discrete Fourier transforms, and performs wavelet-based spectrum estimation.
Wavelets are a family of basis functions that allow for multi-resolution analysis of time series data. Wavelets decompose data into different frequency components, each with a corresponding time interval. This dual localization in time and scale enables the detection of anomalies at multiple resolutions, with precision both in frequency and time.
We can apply wavelet analysis to the detection of outliers as in Bilen and Huzurbazar (2002) which uses the following approach:
1. Perform a Wavelet Transformation: Convert time series data into wavelet coefficients that represent the spectrum. This decomposition provides insights into both rapid changes and gradual shifts.
2. Threshold Wavelet Coefficients: Determine a threshold (e.g. median or absolute deviation) for wavelet coefficients at one or more scales.
3. Detect anomalous Wavelet Coefficients: Wavelet coefficients above the threshold are used to indicate anomalous movement.
4. Identify Outliers: Once anomalous wavelet coefficients are determined, reconstruct the original time series data using the inverse wavelet transform. This procedure allows for determination of which observations in the original time series data gave rise to the anomalous coefficients. These observations are identified as outliers.
EViews uses wavelet outlier settings that broadly match those used in Bilen and Huzurbazar (2002): a single scale time scale, hard thresholding, the False Discovery Rate (FDR) value method, and the Mean Median Absolute Deviation coefficient variance.
Series Outlier Detection in EViews
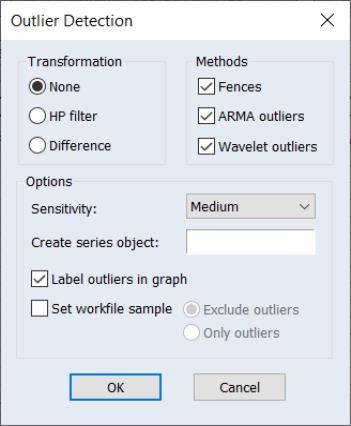
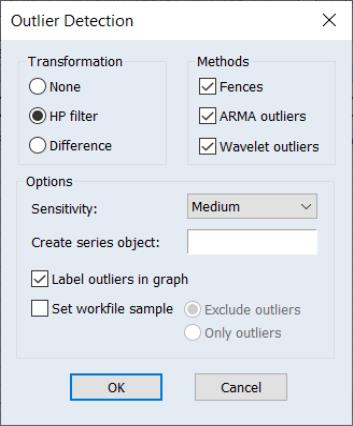
To perform outlier detection of a single series in EViews, open the series, and click on View/Outlier Detection…. EViews will display the dialog:
The Transformation section offers you the ability to perform outlier detection on the original series, or to transform the series to remove trends or cycle. By default, the original series will be employed (), but you can select the Hodrick-Prescott filter (HP filter) to use the cyclical series, or use the first-difference of the series (Difference).
(More complicated transformations or detrending/cycling procedures may be performed by running those procedures on the original series elsewhere in EViews, saving the transformed results, and then performing outlier detection on the resulting transformed series.
The Methods section checkboxes control which outlier detection methods will be performed. By default, all of the methods will be reported. Note that selecting the Fences box will instruct EViews to employ both Tukey and Mean/Standard Deviation fences.
The Options section has a number of options for tailoring the detection routine and its output.
• The Sensitivity drop down box allows you to quickly set the tolerance levels of the outlier detection methods. Sensitivity can be set to Low, Medium, High, or Custom. The values corresponding to the settings are:
| | | |
| 3.0 | 1.5 | 0.4 |
| 4.7 | 2.7 | 1.5 |
| 16.0 | 8.0 | 4.0 |
| 0.0005 | 0.001 | 0.01 |
Note that the corresponds to

for the Tukey and Mean/Standard Deviation fences, the ARMA critical value

, and the False Detection Rate (FDR) for wavelet analysis. Chen and Liu (1993, Section 3.1, p. 288) offer a simulation study which provides some guidance for the specification of the critical value

. If
Custom is selected, a new dialog will open, allowing setting of these values on an individual basis.
• If you enter a valid object name in the Create series object edit field EViews will produce a new binary series object in the workfile containing a value of “1” for any observation that was identified as an outlier, and a value of “0” for any observation that was not determined to be an outlier. Any observations outside of the current workfile sample are assigned a value of NA.
• Checking the Label outliers in graphs checkbox instructs EViews to include the date label of any identified outlier on the output graph.
• If the Set workfile sample checkbox is selected, EViews will set the workfile sample using the results of the outlier analysis. Selecting Exclude outliers will set the sample to the existing workfile sample with outliers excluded. Conversely, selecting Only outliers to those observations in the original sample that are identified as outliers.
In both cases, since setting the sample requires a series in the workfile, if you have not entered a name in the Create series object edit, EViews will automatically add one.
Outlier Detection Example
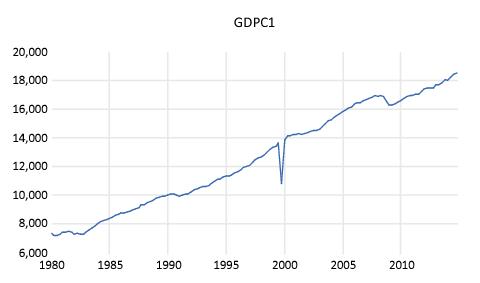
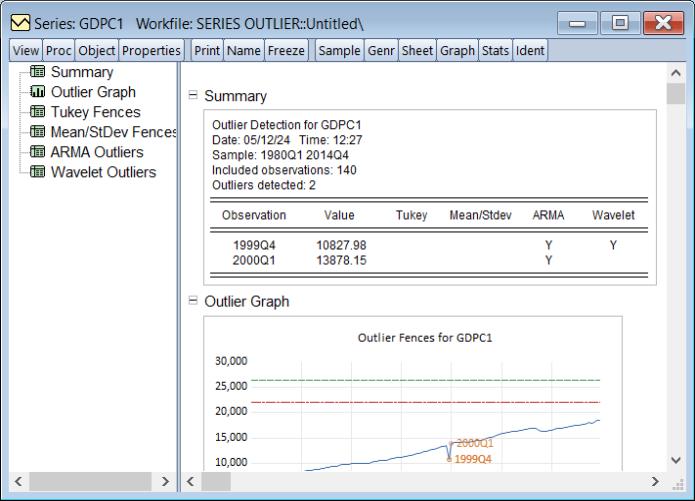
The workfile “Series Outlier.wf1” contains a single series of data holding quarterly real GDP for the United States between 1980 and 2015. Unfortunately, there was a data entry error in the series GDPC1 where observation 1999Q4 was entered incorrectly:
We can use EViews' outlier detection routines to see whether 1999Q4 would be identified correctly as an outlier. Click on View/Outlier Detection, leave all options at their default values, and then click on OK. EViews will conduct the outlier analysis and will to produce the spool output, which is split into distinct sections
The node provides a summary of the outlier detection routine,
From our summary we can see that two outliers were detected: one for 1999Q4, and one for the subsequent period 2000Q1. We can also see that while neither the Tukey or Mean/Standard Deviation fences detected any outliers, both the ARMA and Wavelet methods identified 1994Q4 as outlier. Only the ARMA method identifies 2000Q1 as an outlier.
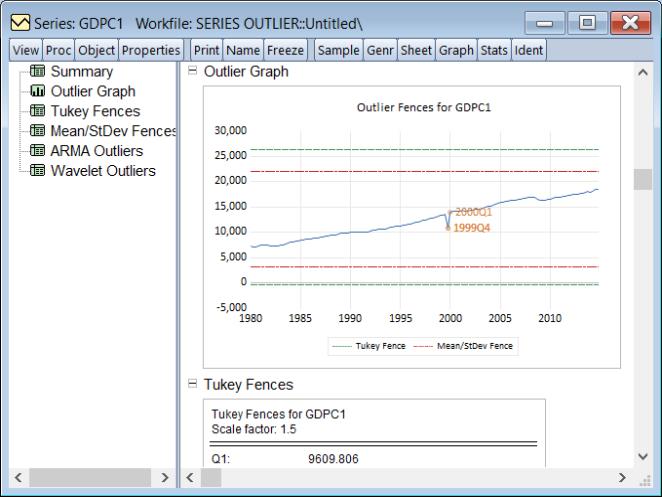
The node provides a graph of the original series, the detected outliers, and the Tukey and mean/standard deviation fences,
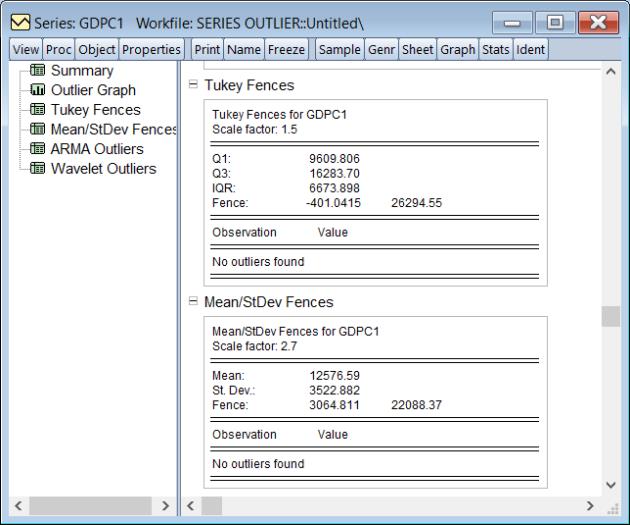
The next four sections provide additional information for the individual detection methods. The and results display information relevant to the construction of the fences:
The tables show the scale factor

, first quartile (Q1), third quartile (Q3), interquartile range (IQR), and the resulting fences used in identifying the Tukey outliers, and the scale factor, mean, standard deviation and the corresponding fences used to identify the Mean/Standard outliers. Both methods report that no observations are outside the fences.
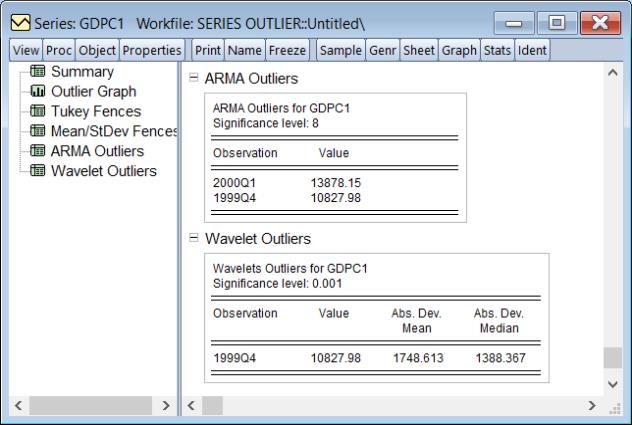
The section lists the outliers detected by the ARMA routine, along with the value of the observation at that date:
The section lists the outliers detected by the Wavelet routine and the absolute deviation from the mean, and the absolute deviation from the median.
It is notable that the neither of the fence methods identifies an outlier. From the original graph of our series, it is obvious that the series exhibits a strong upward trend, which presumably is the reason that the fence methods were unable to detect our outlier. We can alleviate this problem by performing the detection after remove the trend using the Hodrick-Prescott filter. Click on View/Outlier Detection to display the dialog,
9
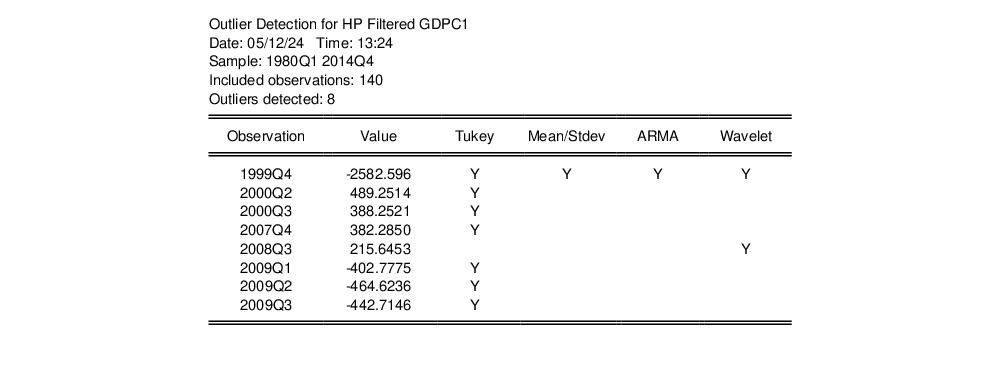
Change the method to and click on to continue. The results are quite different. The table shows a larger number and slightly different set of outliers:
Both the fences methods report outliers, with the Tukey method detecting seven outliers. Of particular note is that all four methods agree that 1999Q4 is an outlier.
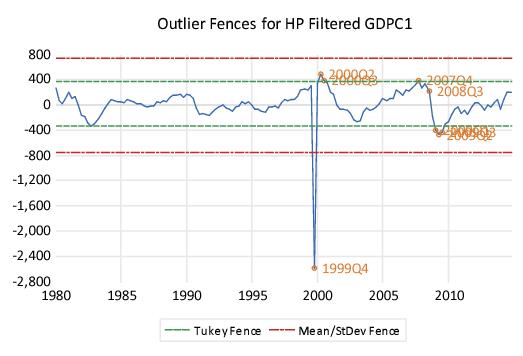
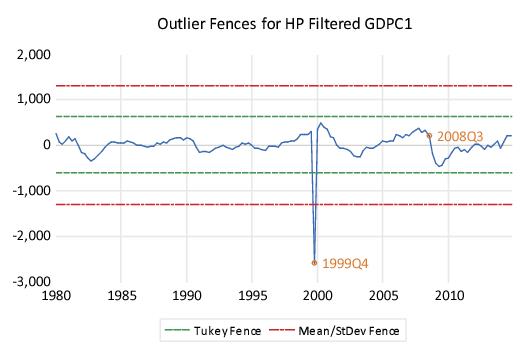
The graph shows the seven outliers and the two sets of fences:
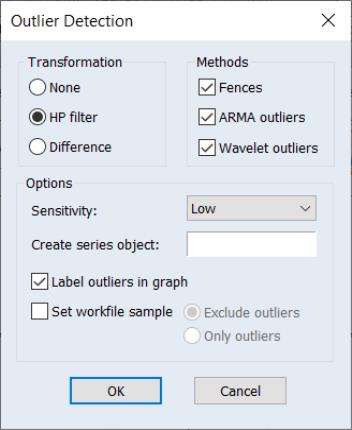
Some of the observations detected by the Tukey fences as outliers may result from natural variation in the cyclical data. We may wish to impose more stringent criteria for whether an observation is an outlier. Click on View/Outlier Detection to display the dialog,
change the to , and click on .
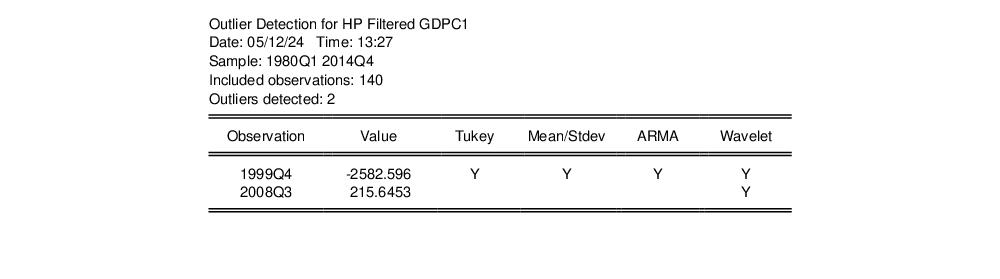
The results show that with lower sensitivity, there are two outliers
and 1999Q4 is still detected by all four methods.