Change Point Tests
EViews computes several different tests for a single change in the location parameter (mean) of a series in non-panel workfiles. Simply click on from the main series menu to perform all of the following tests:
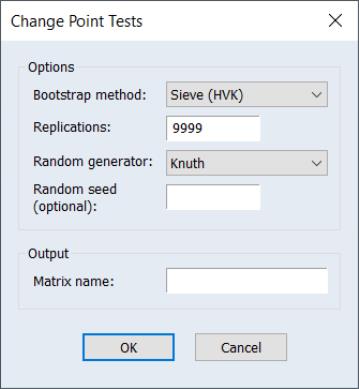
When you click on the menu item, EViews will display a dialog containing bootstrap and output settings:
The Options section of the dialog presents the set of options used in calculating the bootstrapped p-values of the tests.
You may use the drop down menu to choose a bootstrap method: , , , or :
• If you choose , EViews will only compute analytic test results.
• If you select any of the other methods, EViews will compute both analytic and bootstrap test probabilities.
• Selecting computes a bootstrap where we simply resample from the original data.
• The and options compute sieve bootstraps that account for serial dependence in your data.
Sieve bootstrapping accounts for serial dependence in your data by estimating a autoregressive process to the data in the series and using the results to generate a bootstrap sample that preserves the estimated correlation structure. The “sieve” portion of the process refers to the approach of increasing the order

of the autoregressive process slowly with the sample size so that the model accurately captures the dependency structure without overfitting.
The acronym “HVK” refers to the method of Hall and Van Keilegom (2003) papers introduces difference-based methods for estimating error covariance and autoregressive parameters in nonparametric regression with time series errors. Incorporating the HVK method into sieve bootstrapping involves estimate AR coefficients and errors using the HVK method and then generating bootstrap samples using the estimated coefficients and residuals
The remaining settings concern the randomization procedure associated with the bootstrap procedure:
• The Replications edit field specifies the number of bootstrap simulations. The default of 9999 is set so that the bootstrap satisfies the integer conditions for optimal behavior at conventional test sizes (Davidson and MacKinnon, 2004, p. 165).
• The Random generator drop down menu lets you specify the type of random number generator used in the bootstrap simulations.
• You may enter a random number seed in the ed (optional) edit field. You may provide an integer value from 0 to 2,147,483,647, or you may the leave the edit field blank, in which case EViews will use the clock to obtain a seed.
The section contains the Matrix name edit field where you may specify the name of a matrix object in which to store the test statistics and p-values. If this field is left blank, no matrix will be created.
Test Methods
Quandt-Andrews Regression Test
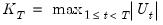
The Quandt-Andrews test (see
“Quandt-Andrews Breakpoint Test”) can be used to test for a change in the mean of a series by running a regression of the time series against a constant and then running the Quandt-Andrews test to test whether the coefficient on the constant (which is an estimate of the mean) changes through time.
Pettitt Ranks Test
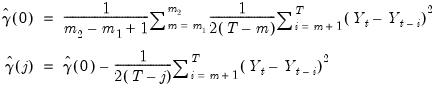
The Pettitt (1979) Rank Test is an application of the Wilcoxon Rank Sum Test (see
“Median Test”), but without the asymptotic normal approximation (which is invalid the repeated nature of the test). The test statistic

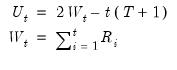
for the null hypothesis of no change in the location parameter of the series' distribution is calculated as:
 | (42.1) |
where
 | (42.2) |
and

is the rank of the
i-th observation of

.
Pettitt shows an approximation for the
p-value for

may be calculated as:
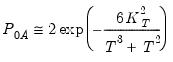 | (42.3) |
This result requires an assumption of no auto-correlation in the time series, which is often violated in economic series. Bootstrapping the p-values can be employed to sidestep this issue.
Buishand Range and U Tests
The Buishand Range test (1982) and U test (1984) are tests for homogeneity of the mean of a series that are based on cumulative deviations from the overall mean of the series. If the mean of the series does not have a change point, you would expect the cumulative deviation from the mean to be close to zero at all time periods. If there is a change in the mean, the cumulative deviation will diverge from zero.
Specifically, let
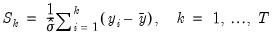 | (42.4) |
where

is the overall sample standard deviation of

.
The Buishand Range test statistic is:
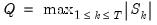 | (42.5) |
And the Buishand U test statistic is:
 | (42.6) |
Both statistics are a test for the null hypothesis that the mean of the series does not change. EViews produces p-values based upon bootstrapping for the Buishand test statistics.
Bootstrap Probabilities
EViews offers two bootstrap methods to provide alternative p-values for the change point (and the trend) tests. These bootstrapped p-values should be more accurate in cases where the underlying time series are auto-correlated.
The ordinary bootstrap method is a simple bootstrap where observations are randomly drawn from the underlying time series, and then test statistics are calculated on the drawn observations.
The sieve bootstrap is a bootstrap method specifically designed to account for auto-correlation in the original series. The sieve bootstrap performs the following steps:
1. Estimate a series of simple AR models from order 0 to 12 on the underlying time series.
2. Use the Schwarz Information Criteria to determine the most appropriate AR order from the models estimated in (1).
3. Re-estimate a model using the order obtained in (2) using either maximum likelihood or the Hall and Van Keilegom (HVK) non-parametric method of estimation of AR coefficients.
4. Perform

simulations of the AR error terms using the coefficients estimated in the previous steps, can calculate the test statistics.
5. p-values are computed as the percentage of the

replications that produce test statistics larger than the original statistic.
The Hall and Van Keilegom (HVK, 2003) method for estimating the coefficients of an AR process is a non-parametric differenced-based approach. This method may be more robust to small samples and non-normal errors than traditional maximum likelihood-based estimation.
In the case of modeling trends, assume that the data follow an AR process:
 | (42.7) |
where

is a smooth function of a time trend, and

are
i.i.d. with variance

and zero mean, and

are such that the expression
has no complex roots that satisfy

.
The HVK estimator estimates
as:
 | (42.8) |
where

and

are arbitrary smoothing parameters.
From these estimates of the covariances, using the Yule-Walker equations, estimates of

can be retrieved.
Change Point Example
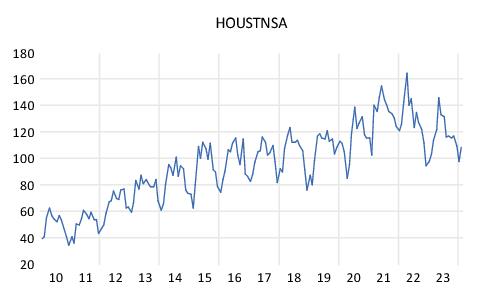
We may perform a change point test using the housing starts data (non-seasonally adjusted) from the Federal Reserve of St. Louis database:
dbopen(type=fred, server=api.stlouisfed.org/fred)
wfcreate m 1959M01 2024M02
fetch(d=fred) houstnsa
smpl 2010m01 2024m02
Note that we have set the workfile sample to 2010m01 to 2024m02. The housing starts data over that period is depicted below:
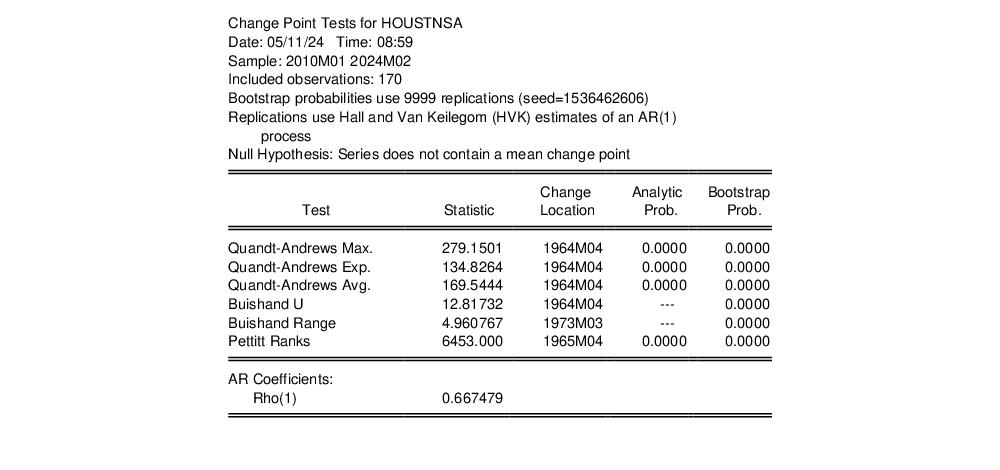
Click on from the HOUSTNSA series menu, and click on to accept the default settings. EViews displays a table showing the test results:
The top portion of the table shows the test settings. Here we see that the bootstrap probabilities were computed from 9999 replications using the Hall and Van Keilegom (HVK) method, which automatically selected an AR(1). The coefficient of the AR(1) is listed at the bottom of the table.
The middle section shows the test results for all of the methods. For each test, EViews reports the test statistic, location of the estimated breakpoint, analytic probability (if available), and bootstrap probability (if requested).
Here, we see that all of the tests strongly reject the null hypothesis of no change in mean.