Printing a Spool
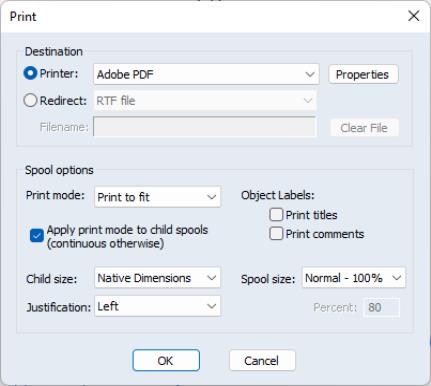
To print the spool object, simply click on the button on the toolbar or select from the main EViews menu to display the dialog.
The top section of the dialog may be used to select a printer and print options, or to redirect the print job to an RTF file, text file, table object, text file, or spool object (see
“Print Setup”).
The remainder of the dialog offers various printing options specific to spool objects.
Print Mode
You may use the dropdown to specify where page breaks are to be used in your print job. There are three possible modes (, , and ). If you select , objects will not, unless larger than a page, be split across pages. In mode, objects in the spool will be printed successively and page breaks will occur when the bottom of a page has been reached. mode prints the spool with a page break after every object. Note that whatever the print mode setting, graph objects are never split across pages.
If the spool contains embedded (child) spools, you will be provided with an additional option for whether to treat the embedded spool as a single output object or to treat it as a set of individual objects. In practical terms, this choice is equivalent to deciding between printing the contents of embedded spools in continuous mode (single object) or printing the objects in the spool using the selected print mode (multiple objects). To employ the latter method, you should check the box labeled .
To demonstrate the effects of selecting this option, assume we have a parent spool containing a table and an embedded spool which contains two graph objects. Suppose that we set the to , and check theoption. The resulting print job will generate three pages of output: a page for the table, and one for each of the individual graphs. Unchecking the option would (if the graphs both fit on a single page), generate two pages of output: one for the table, and a second for both graphs.
Size and Position
You may use the dropdown to specify a custom size for printing. For example, selecting and entering 80 in the field will scale the contents of the spool to 80% of the full size prior to printing.
You may use the to determine the relative size of child objects. Selecting prints the objects in the spool at their native sizes so that they will appear as they would if printed individually, outside of the spool. If instead you select Screen proportional, EViews will print the objects in the spool in the same proportions as the spool display window. All sizing customization in the spool will be used.
The positions of objects on the page is controlled using the dropdown. Choosing or will force all objects to print on the left side or the center of the page. will left-justify table and text objects, and center graph objects.
Labeling
You may use the section of the dialog to control whether to print titles and comments in the spool. Selecting the respective checkbox check will print the additional information along with the output object. These settings are especially useful if you turn on the titles and comments in the spool display, but do not wish to include them in your printed output, or vice versa.