EViews 10 New Features

EViews 10 New Econometrics and Statistics: Testing and Diagnostics
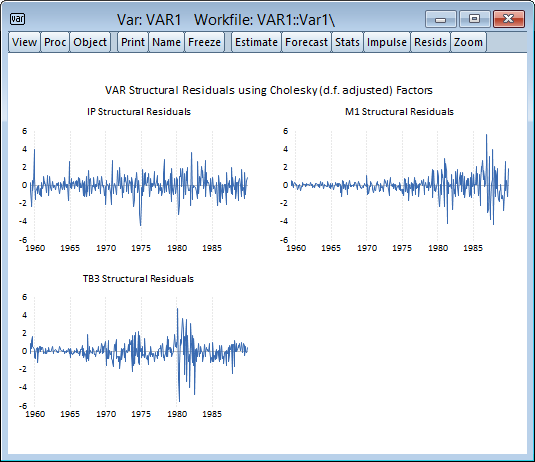
VAR Structural Residuals
Structural residuals play an important role in VAR analysis, and their computation is required for a wide range of VAR analysis, including impulse response, forecast variance decomposition, and historical decomposition.
While EViews has long computed these transformed residuals for internal use, EViews 10 now makes structural residuals available to users.

Improved VAR Serial Correlation Testing
Prior versions of EViews computed the multivariate LM test statistic for residual correlation at a specified order using the LR form of the Breusch-Godfrey test with an Edgeworth expansion correction (Johansen 1995, Edgerton and Shukur 1999).
EViews 10 offers two substantive improvements for testing VAR serial correlation.
- First, in addition to testing for autocorrelation at specified orders, EViews now also tests jointly for autocorrelation for lags 1 to s.
- Second, EViews augments the Edgeworth LR form of the test with the Rao F-test version of the LM statistic as described Edgerton and Shukur (1999) whose simulations suggest it performs best among the many variants they consider.
Model Boundary Checking
EViews 10 lets you specify boundaries for endogenous variables in a model through a new Boundaries dialog page. Although the solver will not enforce the boundaries while solving the model, EViews will warn you if any variable crosses its boundaries (i.e., solves to a value higher than the upper boundary or less than the lower boundary)

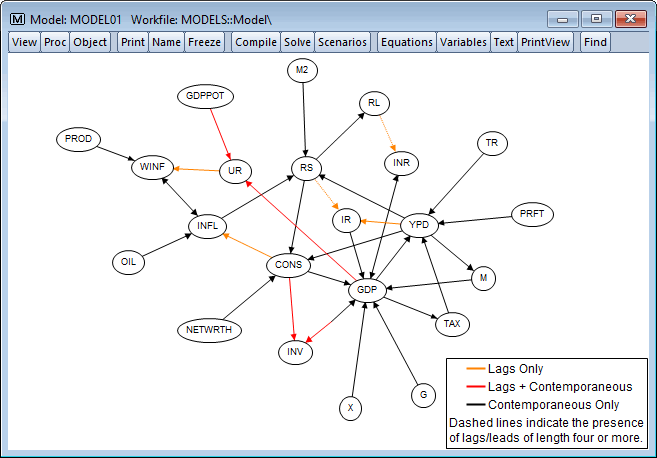
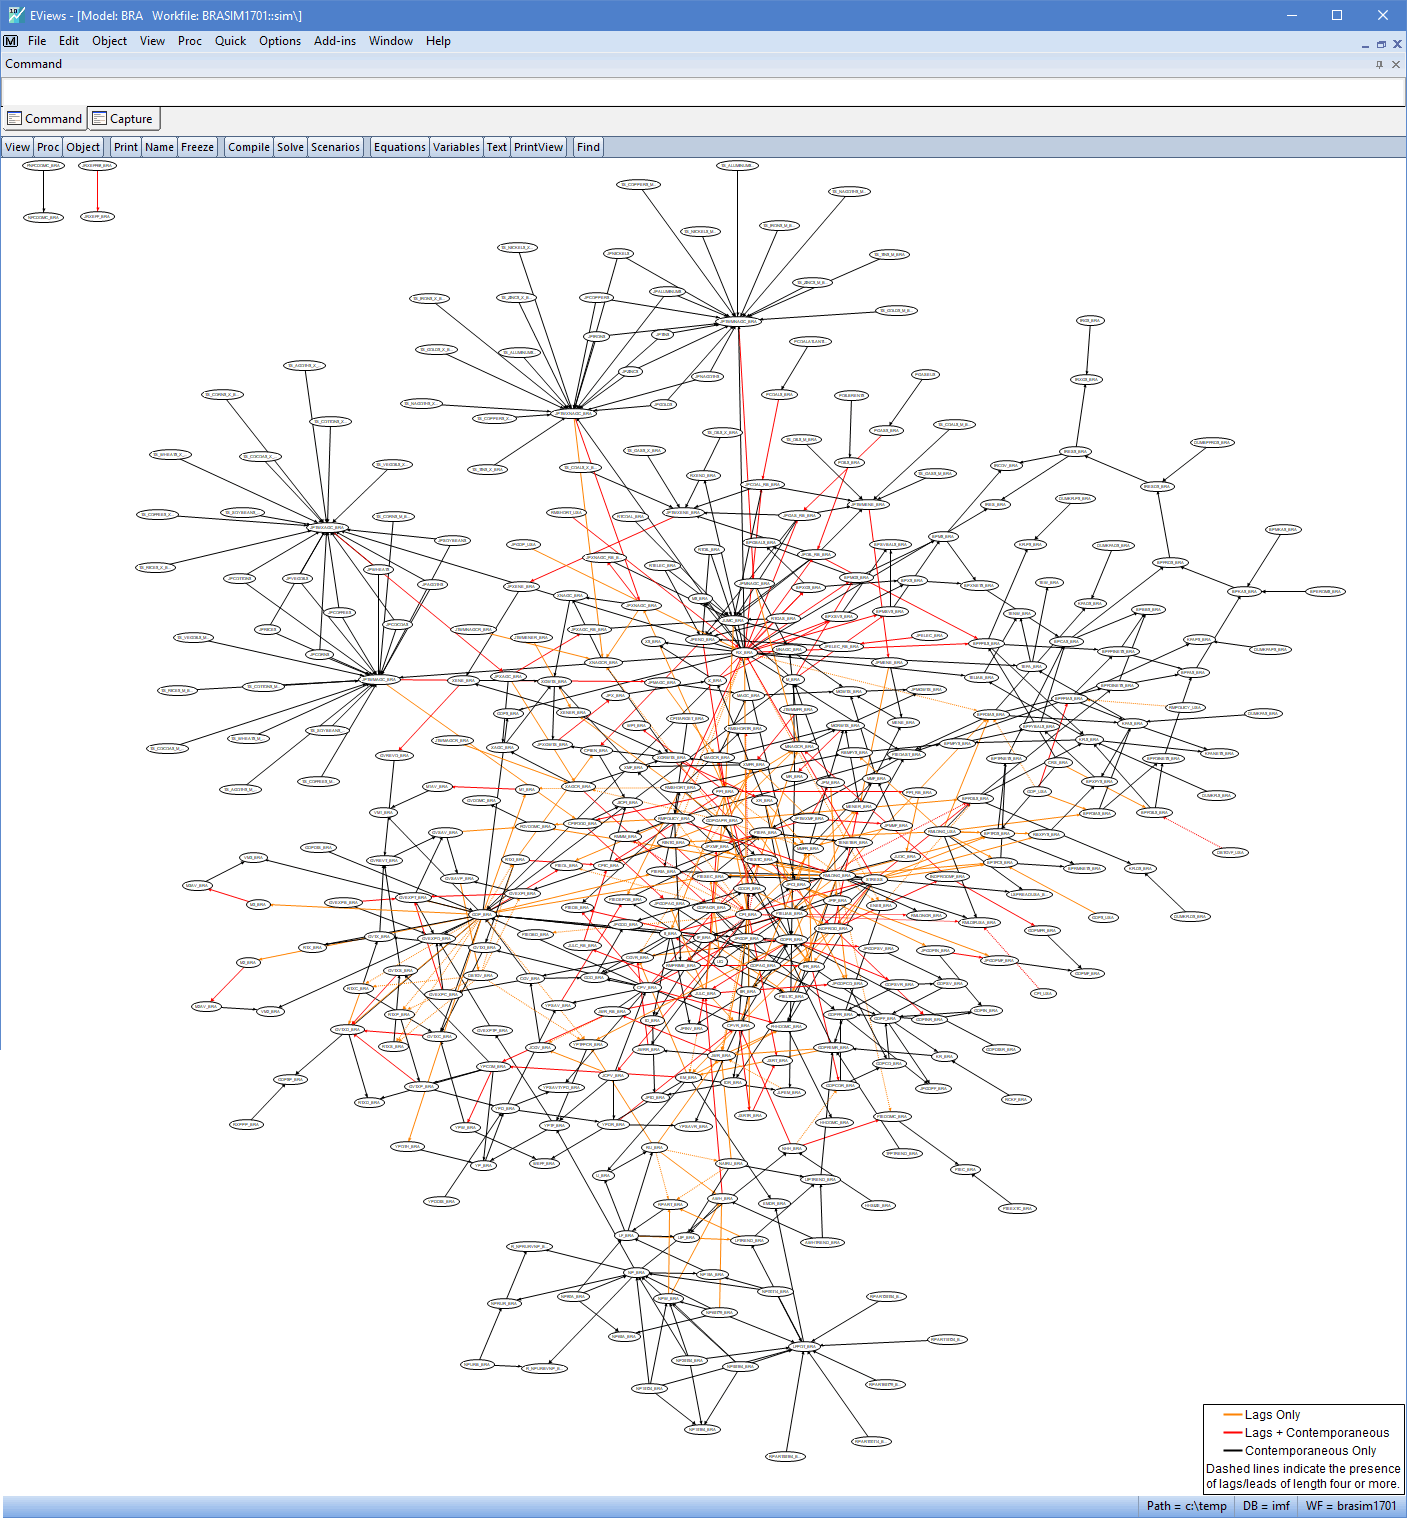
Model Dependency Graph
EViews 10 introduces a new way to graphically view the relationship between variables in your model. Colour coding is used to depict the dynamics in the model, and you can zoom and highlight variables for even greater clarity.