EViews 9.5 New Features

New Graph, Table and Spool Features
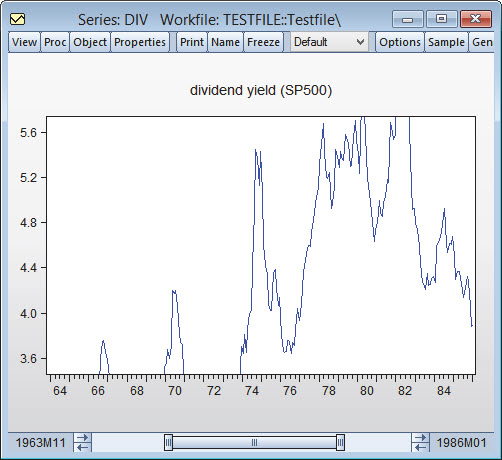
Graph Pan and Zoom
Panning and zooming are now available on graphs and graph views that feature the observation slider bar (allow for graph subsample display). You may use these features to alter the display to focus on particular regions of the graph, much like cropping a photograph.
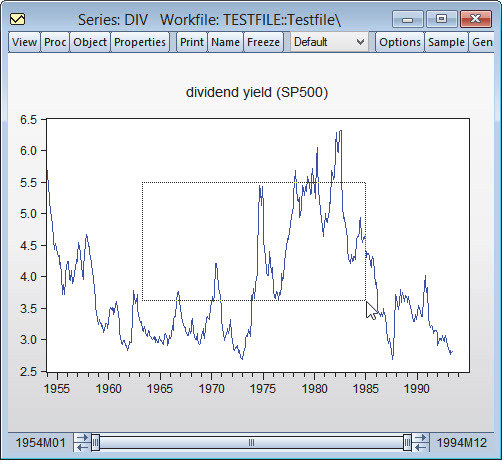
Note that zooming and panning does not change the graph, only the portion of the graph that is displayed in the window. The observation slider bar and axis labels will change to reflect the modified display. Freezing the graph will take a snapshot of the current display.
Multi-Graph Slideshow
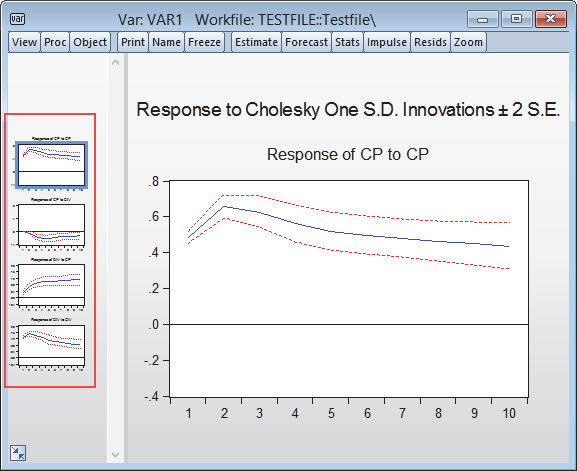
EViews makes viewing multi-graphs easier via the introduction of a graph slideshow. When working with multiple graphs in a single graph frame one sometimes finds that the individual graphs are too small to see any detail. Now you can zoom in on the individual graphs and to display the contents of the graph in a slideshow format.
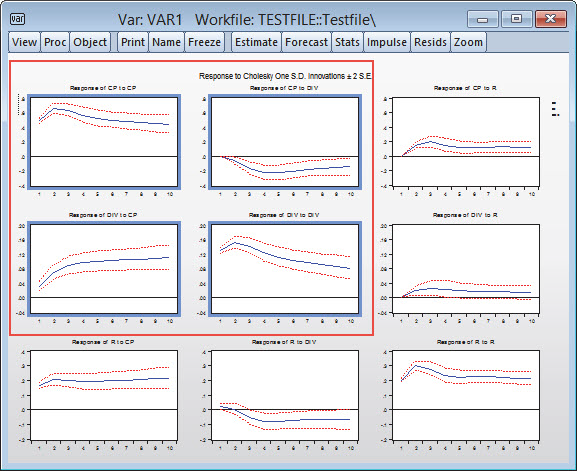
Here we see the zoom view. On the left is a gallery of the individual graphs; on the right is a larger display of the selected graph. You can page through the individual graphs using the arrow keys or Page Up/Page Down to select the next graph, or the Home and End keys to move to the first or last graph. Alternately, you can click on a gallery item to jump to that graph.
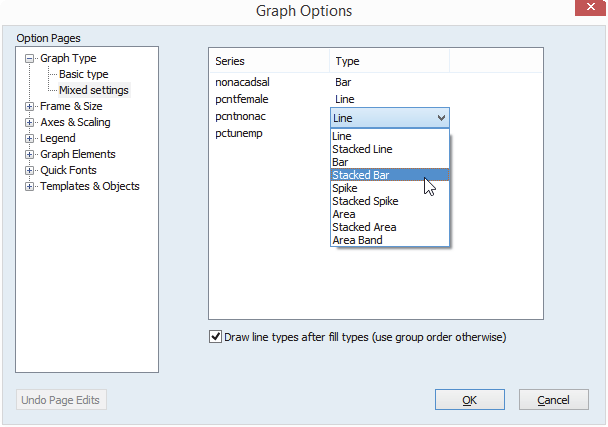
Improved Mixed Graph Types
EViews offers an entirely new interface for mixing graph types, allowing greater flexibility in choosing combinations of graph types to show on the same graph. Display your group data with a spike for the first series, a line for the second, and an bar for the remaining two. The new EViews interface allows you to specify the type of each graph element. Set the first series to spike, the second to line, and the third to area. Or mix up the assignment. The choice is up to you.
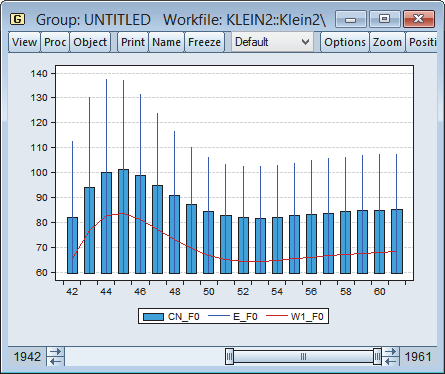
By default, the first series will be plotted as a bar and remaining series will be plotted as lines. You may use the dropdown menus to select different types for each series. If there is a type such as Area Band that requires more than one series, EViews will construct the graph using the series defined by a pair of series. Note that the pairs need not be contiguous.
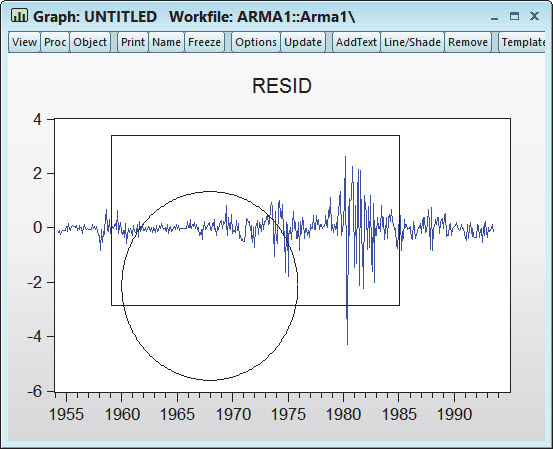
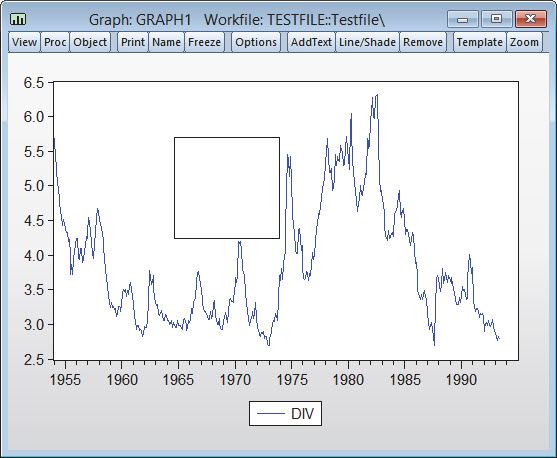
Rectangle and Ellipse Drawing
You may now draw rectangles and ellipses in frozen graph objects. Once your desired shape is created, you can move and resize the shape interactively. To move, hover over the shape to display the dragging hand cursor. Click and drag to the desired position.
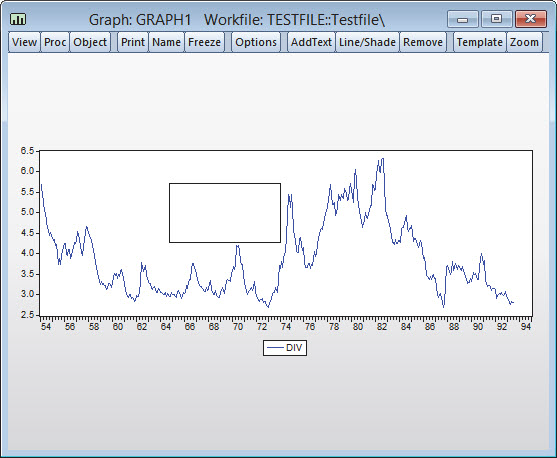
Arrow, Rectangle, and Ellipse Data-based Anchoring
You can now attach arrows, a new rectangle or an ellipse drawing object to fixed data/date points within a graph with greater precision by specifying programmatically the placement of the object. With the data-based anchoring, resizing or movement of the chart will also proportionately resize and move the arrows, rectangle, and ellipse object within the graph.
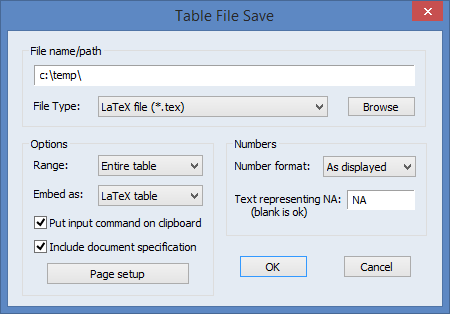
LaTeX Output
You can now save your table, graph, and spool output in LaTeX format.
This feature is available whenever you save a table, graph, or spool to disk (using commands, the table or graph save to disk proc, or the right-mouse button save from a table or graph view). In all of these case, you should select change the File type combo to “LaTeX file” to see the available options.