symbol(arg) | 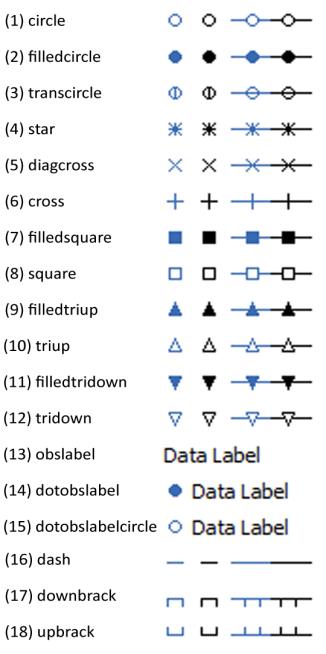 Sets the drawing symbol: arg can be an integer from 1–18, or one of the matching keywords. “obslabel” and “dotobslabel”, and “dotobslabelcircle” use the observation label as the symbol. Selecting a symbol automatically turns on symbol use. The “none” option turns off symbol use. |
symbolsize(arg), symsize(arg) | Sets the symbol size. arg may be an integer between 1-8, where 1 is the smallest symbol and 8 is the largest, or one of the keywords: “XS” (X-Small), “S” (Small), “M” (Medium), “L” (Large), “XL” (X-Large), “2XL” (2X-Large), “3XL” (3X-Large), “4XL” (4X-Large). |
linecolor(arg), lcolor(arg) | Sets the line and symbol color. arg may be one of the predefined color keywords, or it may be specified using individual red-green-blue (RGB) components using the “@RGB” or “@HEX” functions. The arguments to the @RGB function are a set of three integers from 0 to 255, representing the RGB values of the color. The arguments to the “@HEX” function are a set of six characters representing the RGB values of the color in hexadecimal. Each two character set represents a red, green or blue component in the range '00' to 'FF'. For a description of the available color keywords see
“Color definitions”. |
linewidth(n1), lwidth(n1) | Sets the line and symbol width: n1 should be a number between “.25” and “5”, indicating the width in points. |
linepattern(arg), lpat(arg) | 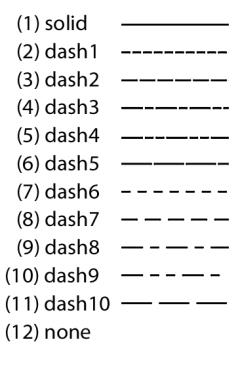 Sets the line pattern to the type specified by arg. arg can be an integer from 1–12 or one of the matching keywords. Note that the option interacts with the graph options for “color”, “lineauto”, “linesolid”, “linepat” (see
Graph::options, for details). You may need to set the graph option for “linepat” to enable the display of line patterns. See
Graph::options. Note also that the patterns with index values 7–11 have been modified since version 5.0. In particular, the “none” option has been moved to position 12. The “none” option turns off lines and uses only symbols. |
lineopacity(arg1[, arg2]) | Sets the line opacity to the value or setting specified by the arg values. The arg can be an value from 0 to 1, or one of the keywords “auto”, “on”, “off”. If the opacity setting currently “on” or “auto” (default), setting the level to 0.0 will make (in relevant cases) the object completely transparent (0% opacity) while a value of 1.0 will make the object completely opaque (100% opacity). Setting opacity to “off” will make the object fully opaque. |
fillcolor(arg), fcolor(arg) | Sets the fill color for symbols, bars, and pies. arg may be one of the predefined color keywords, or it may be specified using individual red-green-blue (RGB) components using the “@RGB” function or “@HEX” functions. The arguments to the @RGB function are a set of three integers from 0 to 255, representing the RGB values of the color. The arguments to the “@HEX” function are a set of six characters representing the RGB values of the color in hexadecimal. Each two character set represents a red, green or blue component in the range '00' to 'FF'. For a description of the available color keywords see
“Color definitions”. |
fillgray(n1), gray(n1) | 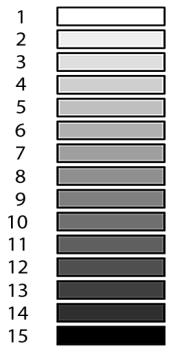 Sets the gray scale for bars and pies: n1 should be an integer from 1–15 corresponding to one of the predefined gray scale settings (from lightest to darkest). |
fillhatch(arg), hatch(arg) | 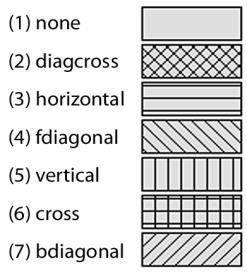 Sets the hatch characteristics for bars and pies: arg can be an integer from 1–7, or one of the matching keywords. |
fillopacity(arg1[, arg2]), | Sets the fill opacity to the opacity to the value or setting specified by the arg values. The arg can be an value from 0 to 1, or one of the keywords “auto”, “on”, “off”. If the opacity setting currently “on” or “auto” (default), setting the level to 0.0 will make (in relevant cases) the object completely transparent (0% opacity) while a value of 1.0 will make the object completely opaque (100% opacity). Setting opacity to “off” willmake the object fully opaque. |
preset(n1) | Sets line and fill characteristics to the specified EViews preset values, where n1 is an integer from 1–30. Simultaneously sets “linecolor”, “linepattern”, “linewidth”, “symbol”, “fillcolor”, “fillgray”, and “fillhatch” to the EViews predefined definitions for graph element n1. When applied to boxplots, the line color of the specified element will be applied to the box, whiskers, and staples. |
default(n1) | Sets line and fill characteristics to the specified user-defined default settings where n1 is an integer from 1–30. Simultaneously sets “linecolor”, “linepattern”, “linewidth”, “symbol”, “fillcolor”, “fillgray”, and “fillhatch” to the values in the user-defined global defaults for graph element n1. When applied to boxplots, the line color of the specified settings will be applied to the box, whiskers, and staples. |
axis(arg), scale(arg) | |
legend(str) | Assigns legend text for the element. str will be used in the legend to label the element. |