EViews 9 New Features

"The new graph slider makes it easy to narrow in on the data of interest…"
New Graph, Table and Spool Features
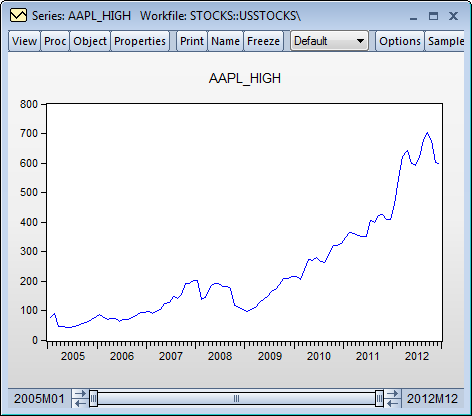
Graph Sample Slider Bar
EViews 8 graphs now feature a sample slider bar, located at the bottom of a sample based graph window which allows you to adjust dynamically the sample displayed in the graph window by resizing and moving the slider bar:
Graph Arrows and Lines
It’s often useful to accentuate a data point in a graph or draw a comparison between two points. In EViews 8, you can draw custom straight lines at any angle, anywhere in a frozen graph window. You may also choose from multiple designs for the arrowheads, including none (plain line), filled arrow, and open arrow.
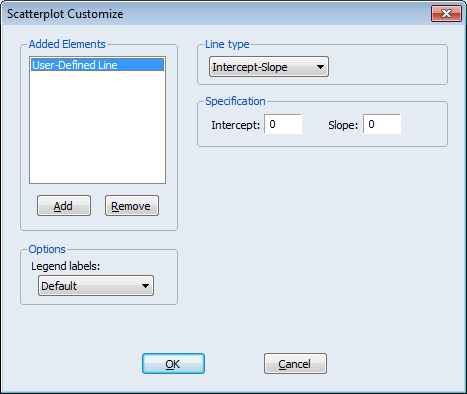
User-Defined Fit Lines
Just as you may wish to highlight a particular data point in your graph with an arrow, you might like to add custom fit lines to a scatter plot. Earlier versions of EViews supported fit lines drawn using calculations based upon the underlying data. The new fit line option, User-defined, lets you specify your own definition line definition.
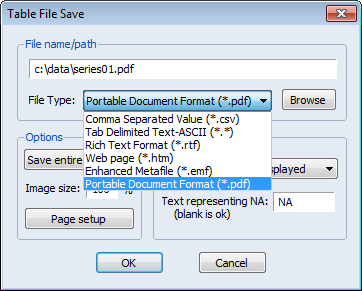
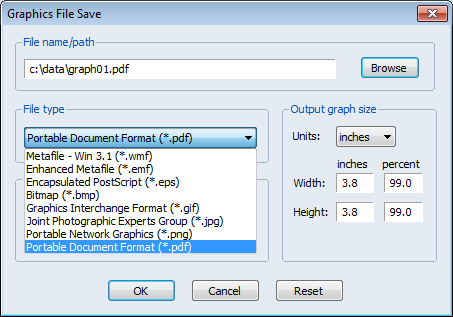
PDF and Enhanced Metafile Export
The PDF format is one of the most commonly used standards for saving and sharing documents, and is arguably the standard for documents on the web. EViews 8 now supports the saving of graph, table, and spool output to PDF. The options to save as PDF are included in the standard save dialogs for graphs, tables, and spools.
In addition, table output may now be saved to Enhanced Metafile (EMF) format.