Trend Tests
Many economic time series follow a time-trend. Identification of the presence of trends is important, both for intrinsic interest and as a preliminary step for further econometric analysis.
Classical econometrics would test for the presence of a trend by formulating a relationship between the variable and a trend term, and then estimating the parameters of that model to test the relationship. More recently, non-parametric tests for the presence of a trend have been developed. Typically, these non-parametric tests require fewer assumptions about the true underlying model and are robust to much smaller sample sizes.
This view is available in non-panel workfiles.
To perform both classical and non-parametric trend tests on a series in EViews, click on from the main series menu to perform the following tests:
The first two tests are parametric and the last three tests are non-parametric.
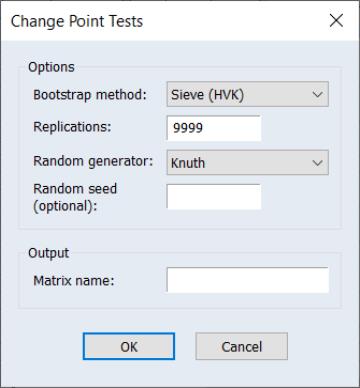
The Options section of the dialog includes the options used in calculating the bootstrapped p-values of the tests.
You may use the drop down menu to choose a bootstrap method: , , , or :
• If you choose , EViews will only compute analytic test results.
• If you select any of the other methods, EViews will compute both analytic and bootstrap test probabilities.
• Selecting computes a bootstrap where we simply resample from the original data.
• The and options compute sieve bootstraps that account for serial dependence in your data.
Sieve bootstrapping accounts for serial dependence in your data by estimating a autoregressive process to the data in the series and using the results to generate a bootstrap sample that preserves the estimated correlation structure. The “sieve” portion of the process refers to the approach of increasing the order

of the autoregressive process slowly with the sample size so that the model accurately captures the dependency structure without overfitting.
The acronym “HVK” refers to the method of Hall and Van Keilegom (2003) papers introduces difference-based methods for estimating error covariance and autoregressive parameters in nonparametric regression with time series errors. Incorporating the HVK method into sieve bootstrapping involves estimate AR coefficients and errors using the HVK method and then generating bootstrap samples using the estimated coefficients and residuals
The remaining settings concern the randomization procedure associated with the bootstrap procedure:
• The Replications edit field specifies the number of bootstrap simulations. The default of 9999 is set so that the bootstrap satisfies the integer conditions for optimal behavior at conventional test sizes (Davidson and MacKinnon, 2004, p. 165).
• The Random generator drop down menu lets you specify the type of random number generator used in the bootstrap simulations.
• You may enter a random number seed in the ed (optional) edit field. You may provide an integer value from 0 to 2,147,483,647, or you may the leave the edit field blank, in which case EViews will use the clock to obtain a seed.
See the description of
“Bootstrap Probabilities” for additional discussion.
The section contains the Output statistics to matrix edit field for you to specify the name of a matrix object to store the test statistics and p-values. Simply enter the name of the matrix object you wish to be created in the workfile. If this field is left blank, no matrix will be created.
Test Methods
Linear trend t-Test
The linear trend F-test performs a test the null hypothesis of no trend against an alternative hypothesis of a linear trend.
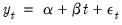
Under the alternative, linear trend hypothesis, we may specify the parametric model:
 | (42.9) |
This parametric specification may be estimated using least squares, and we may use a a
t-test of the hypothesis

may be used to evaluate the hypothesis.
performed. This test assumes a specific linear relationship between the time series and the trend.
Quadratic trend F-Test
The quadratic trend F-test performs a test the null hypothesis of no trend against an alternative hypothesis of a quadratic trend.
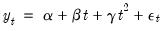
The quadratic trend hypothesis implies a test equation with trend and squared trend terms:
 | (42.10) |
This parametric specification is estimated using least squares and a
F-test of the hypothesis

may be used to test the hypothesis.
Mann-Kendall Test
The Mann-Kendall test performs a test the null hypothesis of no monotonic trend against an alternative hypothesis of a monotonic trend.
Mann-Kendall is a simple non-parametric test based upon Kendall's Tau significance test (see
“Kendall’s Tau”) to test whether the time series is correlated with a time trend.
The distributional assumptions of the test are few but the test does require that the data are not serially correlated. Economic data often violates this assumption, resulting in inaccurate p-values. To overcome this, bootstrapping is used to produce p-values for the test in EViews.
Seasonal Mann-Kendall Test
The seasonal Mann-Kendall test performs a test the null hypothesis of no monotonic trend against an alternative hypothesis of a seasonal monotonic trend.
The seasonal Mann-Kendall Test is an extension of the standard Mann-Kendall test that is applicable if the time series are of monthly or quarterly frequency. The test procedure performs Mann-Kendall test on subsets of the data split by month or quarter, i.e., perform 12 MK tests if the data are monthly, and 4 MK tests if the data are quarterly. The seasonal Mann-Kendall test statistic is computed as the sum of the individual test statistics.
Due to the nature of the sub-sampling, bootstrapped p-values are not available for the seasonal Mann-Kendall test.
Cox-Stuart Test
The Cox-Stuart test performs a test the null hypothesis of no monotonic trend against an alternative hypothesis of a monotonic trend.
Cox-Stuart is an application of a Sign test (see
“Median Test”) which pairs the observations of the first third of the data with those in the last third and tests whether the medians of the two groups are equal.
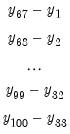
Specifically, the test is calculated by taking the pair-wise difference between the observations in the first third of the data and the final third of the data. For example, if you have 100 observations, calculate:
 | (42.11) |
Once those differences have been calculated, the number of positive differences and negative differences are counted, and the test statistic is given by:
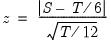 | (42.12) |
Where

is the maximum of the number of positive differences or negative differences, and

is the total number of observations. If

, a continuity correction of -0.5 is applied to the denominator.
If the data are not serially correlated,

is normally distributed, allowing calculation of standard p-values. As with the Mann-Kendall test, EViews includes bootstrapped p-values since this assumption is often violated.
Wang, Akritas, and Van Keilegom (WAVK) Test
The WAVK test is a test of the null hypothesis of no trend against an alternative hypothesis of a generic trend.
WAVK is a non-parametric diagnostic test for the suitability of the functional form of a regression, and was applied to the testing of trends by Lyubchicha, Gel, and El-Shaarawi (2013).
The WAVK test statistic takes the form of:
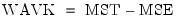 | (42.13) |
where
 | (42.14) |
and, in the Lyubchicha, Gel, and El-Shaarawi application of the statistic,
• 
is a

-period moving average of

,
• 
is the mean of

,
• 
is the
i-th element of

, and
• 
is the

-th element of

.
EViews sets
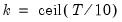
.
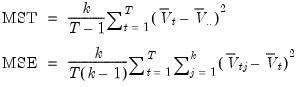
Under suitable assumptions, the WAVK statistic can be shown to be distributed as:
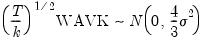 | (42.15) |
where an estimate of

can be given by:
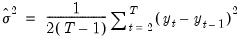 | (42.16) |
As with the other test statistics, the WAVK test's implementation in EViews includes bootstrapped p-values for cases where the assumption of no-serial correlation is violated.
Bootstrap Probabilities
EViews offers two bootstrap methods to provide alternative p-values for the trend (and the change point) tests. These bootstrapped p-values should be more accurate in cases where the underlying time series are auto-correlated.
See the description of
“Bootstrap Probabilities” for additional discussion.
Trend Test Example
We may perform a trend test using the housing starts data described previously.
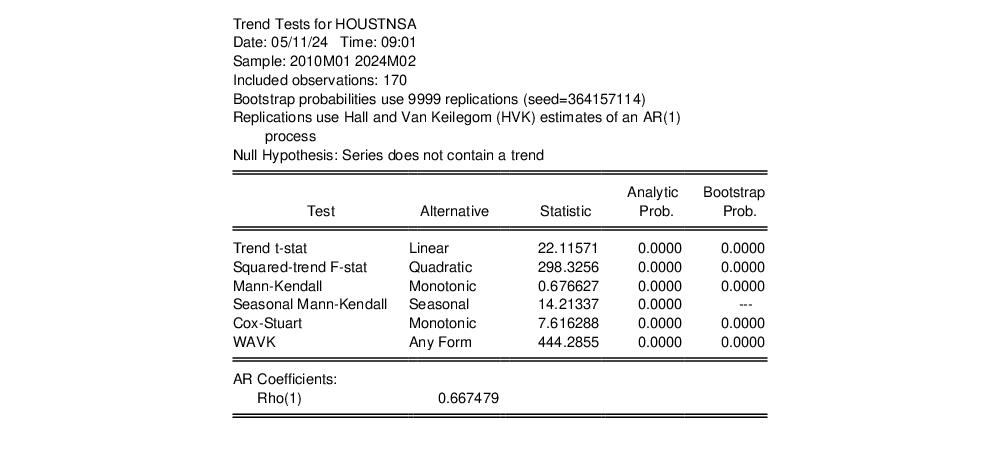
Click on from the HOUSTNSA series menu, and click on to accept the default settings. EViews displays a table showing the test results:
AZ
The top portion of the table shows the test settings. Here we see that the bootstrap probabilities were computed from 9999 replications using the Hall and Van Keilegom (HVK) AR(1) estimates. The coefficient of the AR(1) is listed at the bottom of the table.
The middle section shows the test results for all of the methods. For each test, EViews reports the alternative hypothesis, test statistic, analytic probability (if available), and bootstrap probability (if requested, and available).
Here, we see that all of the tests strongly reject the null hypothesis of no trend.